EURUSD Technical Analysis 2016, 30.10 - 06.11: bearish with ranging rally
Forum on trading, automated trading systems and testing trading strategies
Sergey Golubev, 2016.10.29 08:01
Weekly EUR/USD Outlook: 2016, October 30 - October 06 (based on the article)
EUR/USD struggled to recover, but it also did not extend its falls. A mix of PMIs, inflation figures and also GDP stand out at the turn of the month. Here is an outlook for the highlights of this week.
- German Retail Sales: Monday, 7:00.
- CPI: Monday, 10:00.
- GDP: Monday, 10:00. The 19-country eurozone has grown by 0.3% q/q in Q2 2016, and further growth is on the cards also in Q3. Spain’s growth remains encouraging, but France lags behind.
- Spanish Unemployment Change: Wednesday, 8:00.
- Manufacturing PMIs: Wednesday morning: 8:15 for Spain, 8:45 for Italy, 8:50 the final number for France, 8:55 final figure for Germany and 9:00 final figure for the euro-zone.
- German Unemployment Change: Wednesday, 8:55.
- ECB Economic Bulletin: Thursday, 9:00. Two weeks after the European Central Bank left its policies unchanged, the Frankfurt-based institution releases the data that its members saw before making the decision.
- Unemployment Rate: Thursday, 10:00.
- Services PMIs: Friday morning: 8:15 for Spain, 8:45 for Italy, 8:50 the final number for France, 8:55 final figure for Germany and 9:00 final figure for the euro-zone.
- PPI: Friday, 10:00.
Forum on trading, automated trading systems and testing trading strategies
Sergey Golubev, 2016.10.29 08:19
Week Ahead: FX Markets Into RBA, BoJ, FOMC, And BoE - Credit Agricole (based on the article)
FOMC: "We believe that any taper tantrum angst is premature, however. Next week’s Fed meeting should make an explicit reference to a rate move in December but there seems to be less scope for aggressive tightening of US financial conditions given that the implied probability of a hike is already close to 75%. We doubt that there will be a sustained risk selloff either, especially if the non-farm payrolls and ISM data underpins the constructive outlook for the US economy and adds to the recent stream of positive economic surprises from around the world. Next to the Fed and US data, more evidence of growing demand for USD-funding, reflected in widening of EUR-USD and JPY-USD cross currency swap rates, and elevated USD/CNH rates, should keep USD supported."
Forum on trading, automated trading systems and testing trading strategies
Eur/usd is ranging.
Thomas Lawson, 2016.11.01 09:39
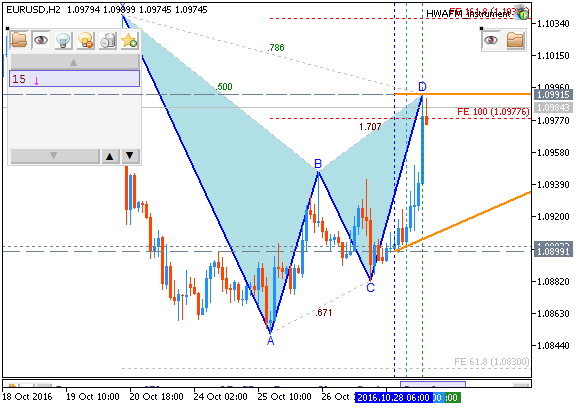
The eur/usd is ranging between Fibonacci levels 23% and 38% awaiting the FOMC interest rate decision on Wednesday.Hi..sell or buy?
This is the technical analtysis, and the technical analysis is not telling exactly about sell or buy - it tells about the market condition in the of some support/resistance levels are broken.
This is from the first post of the thread:
Forum on trading, automated trading systems and testing trading strategies
EURUSD Technical Analysis 2016, 30.10 - 06.11: bearish with ranging rally
Sergey Golubev, 2016.10.30 06:43
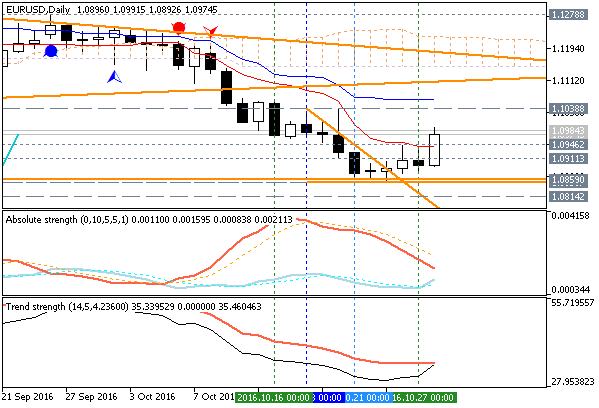
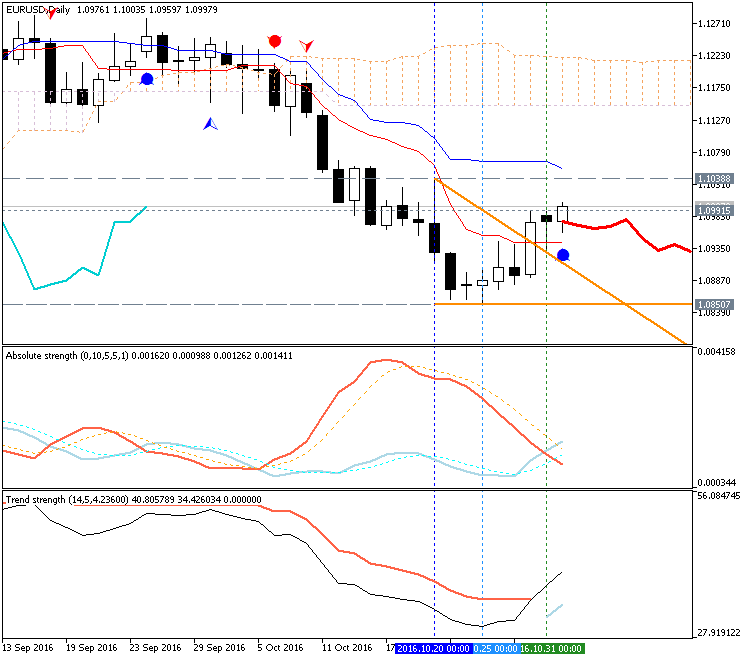
Daily price is on located below Ichimoku cloud in the bearish area of the chart. The price was started with the local uptrend as the secondary rally within the primary bearish market condition and with 1.1038 resistance level to be crossed to above for the bear market rally to be continuing.
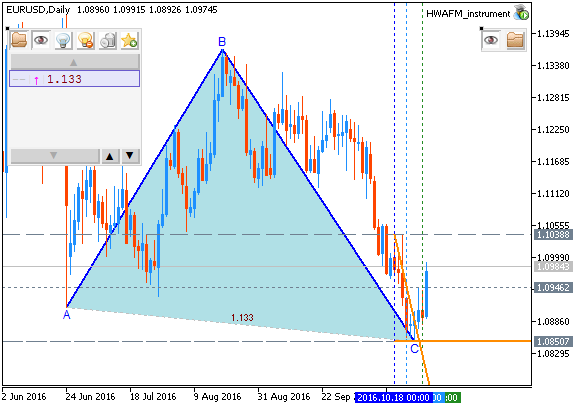
By the way, the descending triangle pattern was formed by the price to be crossed to below for the bearish trend to be resumed, Trend Strength indicator is estimating the trend as the bearish, but Absolute Strength indicator together with Chinkou Span line of Ichimoku are evaluating the future trend as the bearish with ranging rally.
If D1 price breaks 1.0859 support level on close bar so the primary bearish trend will be resumed with 1.0814 bearish target.If D1 price breaks 1.1038 resistance level on close bar from below to above so the local uptrend as the bear market rally will be continuing.
If D1 price breaks 1.1278 resistance level on close bar from below to above so we may see the reversal of the daily price movement from the ranging bearish to the primary bullish market condition.
If not so the price will be on bearish ranging within the levels.
- Recommendation for long: watch close D1 price to break 1.1038 for close bar for possible buy trade
- Recommendation to go short: watch D1 price to break 1.0859 support level on close daily bar for possible sell trade
- Trading Summary: ranging rally
| Resistance | Support |
|---|---|
| 1.1038 | 1.0859 |
| 1.1278 | 1.0814 |
SUMMARY: bearish
TREND: bear market rally
Some people are using the technical analysis in trading by openning pending orders near s/r levels, so that is why I am making the following (from the first post too):
- Recommendation for long: watch close D1 price to break 1.1038 for close bar for possible buy trade
- Recommendation to go short: watch D1 price to break 1.0859 support level on close daily bar for possible sell trade
- Trading Summary: ranging rally
So, it should be buy stop order a little above 1.1038, and sell stop order at few pips below 1.0859 for example (on daily chart and on Monday morning).
Besides, if those levels are daily ones so they can be changed on daily bassis, it means: those are dynamical support/resistance levels.
For example, the situation for today:
- 1.1038 resistance level was not broken to above so the price is still in the bearish area of the chart and the secondary rally is not started yet;
- 1.0859 was not broket to below, so the primary bearish trend is not resumed for now.
- new daily level was formed as 1.0850 (instead of 1.0859) together with descending triangle pattern to be crossed to below for the bearish trend to be resumed.
- for now - the price is still on the bearish for the ranging within 1.1038 resistance level and 1.0850 support level.
So, nothing was changed so far since Monday morning for example (I am talking about daily chart).
If we look at intra-day chart (H4 for example) so we can see that the price is located above Ichimoku cloud for the primary bullish market condition. Besides, Chinkou Span line of Ichimoku indicator (green line on the left of the chart) is above the price too indicating the bullish trend with breakout: the price is breaing 1.1000 psy level to above (on open H4 bar for now) for the bullish breakout to be continuing with with 1,1038 level as a daily target to re-enter.
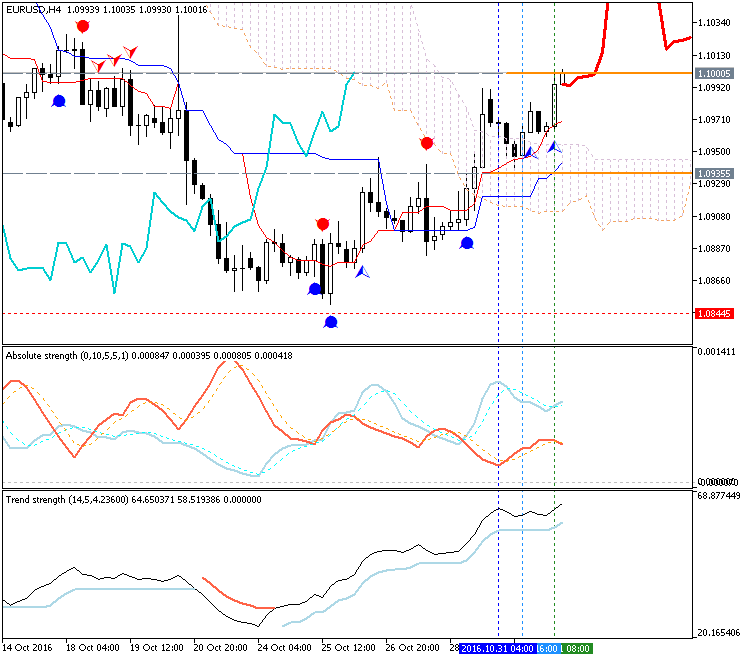
But please not, that we are still having primary downtrend situation (primary bearish market condition) on the daily timeframe (daily chart), and this uptrend/downtrend (bullish/bearish) for H4 timeframe is just the intra-day price movement only (because this is the primary bearish on weekly chart, and the primary bearish market condition on monthly chart).
Forum on trading, automated trading systems and testing trading strategies
Sergey Golubev, 2016.11.01 16:17
Intra-Day Fundamentals - EUR/USD, USD/CAD and USD/JPY : Manufacturing ISM Report On Business
2016-11-01 14:00 GMT | [USD - ISM Manufacturing PMI]
- past data is 51.5
- forecast data is 51.8
- actual data is 51.9 according to the latest press release
if actual > forecast (or previous one) = good for currency (for USD in our case)
[USD - ISM Manufacturing PMI] = Level of a diffusion index based on surveyed purchasing managers in the manufacturing industry.
==========
From official report:
image]
==========
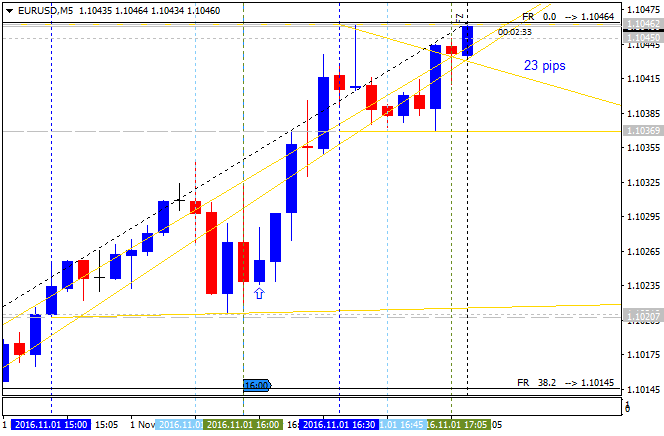
EUR/USD M5: 23 pips range price movement by ISM Manufacturing PMI news events
==========
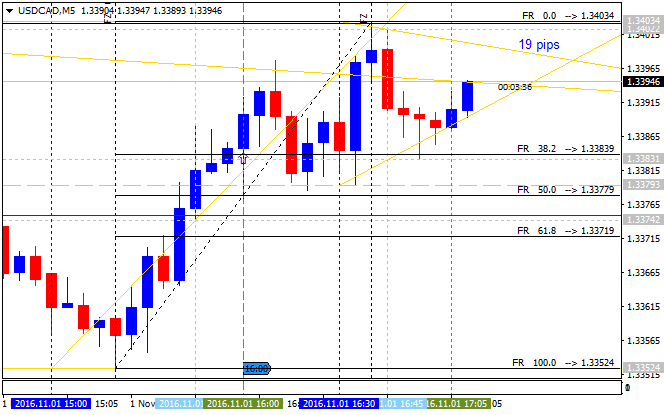
USD/CAD M5: 19 pips range price movement by ISM Manufacturing PMI news events
==========
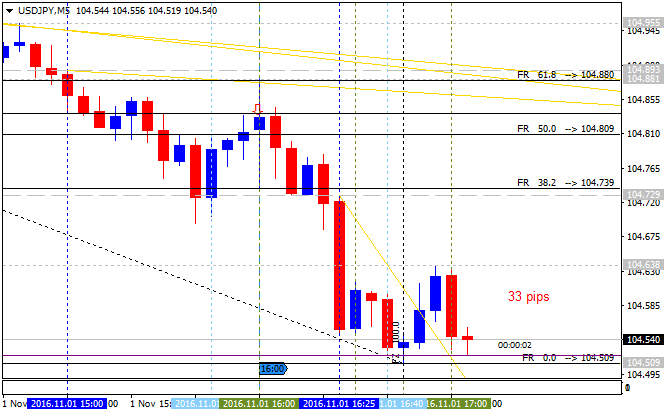
USD/JPY M5: 33 pips range price movement by ISM Manufacturing PMI news events
Forum on trading, automated trading systems and testing trading strategies
Sergey Golubev, 2016.11.02 13:34
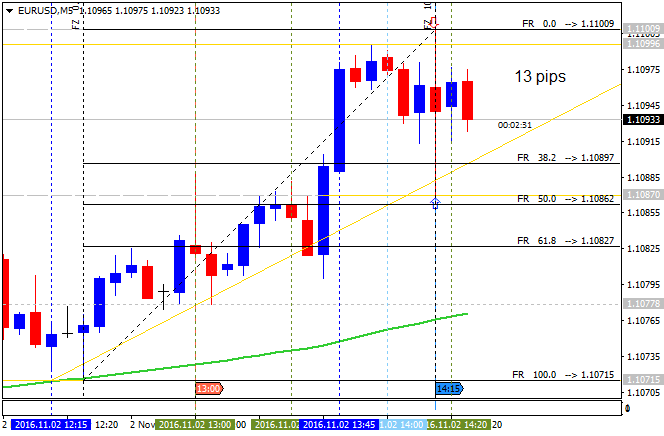
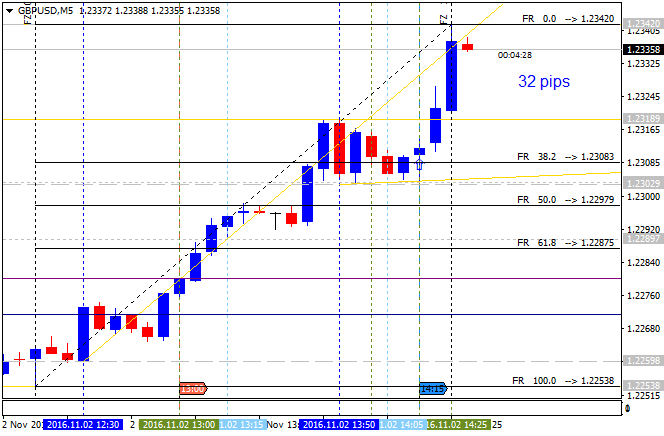
Intra-Day Fundamentals - EUR/USD, and GBP/USD : ADP Non-Farm Employment Change
2016-11-02 12:15 GMT | [USD - ADP Non-Farm Employment Change]
- past data is 202K
- forecast data is 166K
- actual data is 147K according to the latest press release
if actual > forecast (or previous one) = good for currency (for USD in our case)
[USD - ADP Non-Farm Employment Change] = Estimated change in the number of employed people during the previous month, excluding the farming industry and government.
==========
From official report:
==========
EUR/USD M5: 13 pips range price movement by ADP Non-Farm Employment Change news events
==========
GBP/USD M5: 32 pips range price movement by ADP Non-Farm Employment Change news events
Forum on trading, automated trading systems and testing trading strategies
Sergey Golubev, 2016.11.02 19:35
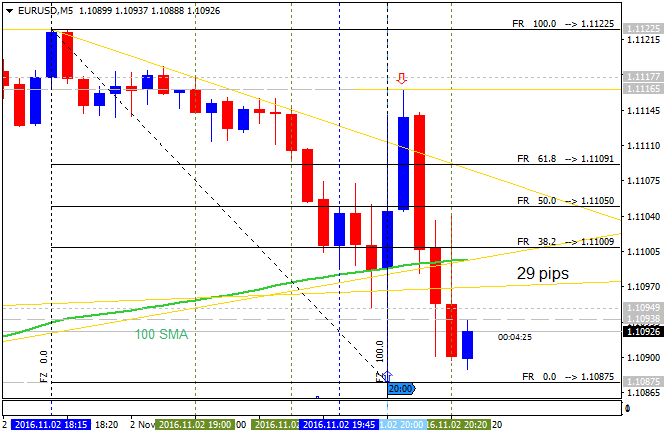
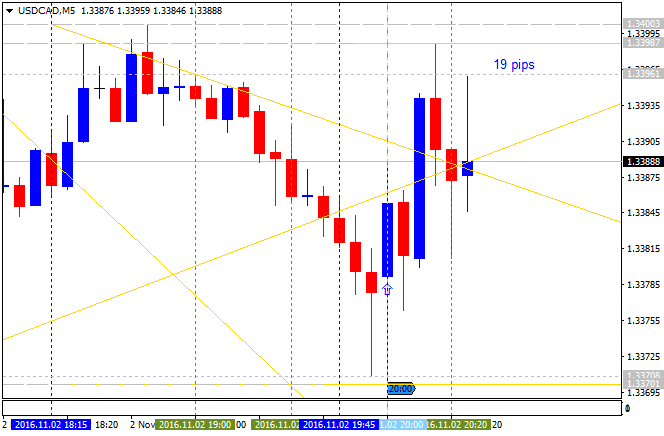
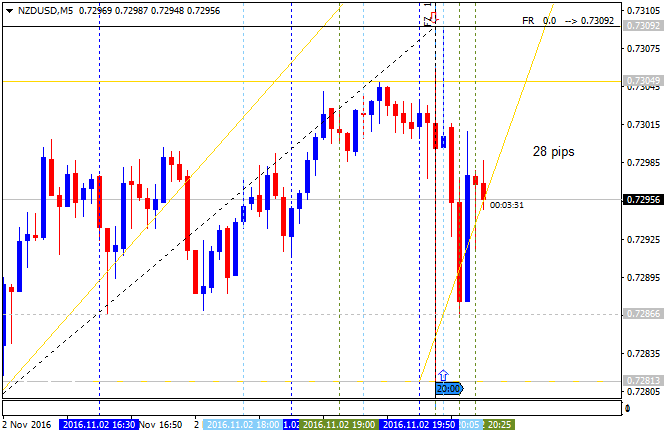
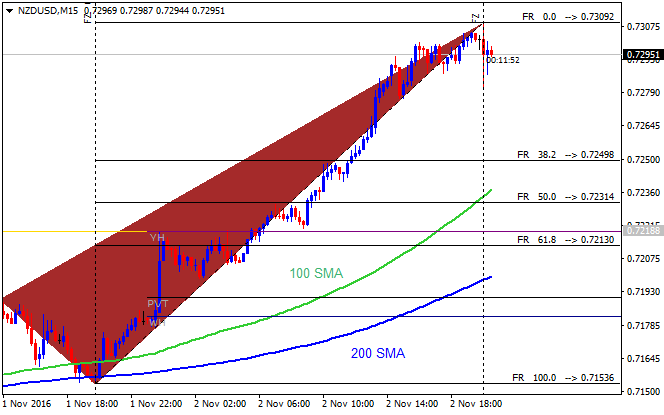
Intra-Day Fundamentals - EUR/USD, USD/CAD and NZD/USD : Federal Funds Rate and Federal Open Market Committee Statement
2016-11-02 18:00 GMT | [USD - Federal Funds Rate]
- past data is 0.50%
- forecast data is 0.50%
- actual data is 0.50% according to the latest press release
if actual > forecast (or previous one) = good for currency (for USD in our case)
[USD - Federal Funds Rate] = Interest rate at which depository institutions lend balances held at the Federal Reserve to other depository institutions overnight.
==========
From official report:
- "Inflation has increased somewhat since earlier this year but is still
below the Committee's 2 percent longer-run objective, partly reflecting
earlier declines in energy prices and in prices of non-energy imports.
Market-based measures of inflation compensation have moved up but remain
low; most survey-based measures of longer-term inflation expectations
are little changed, on balance, in recent months."
- "Against this backdrop, the Committee decided to maintain the target range for the federal funds rate at 1/4 to 1/2 percent. The Committee judges that the case for an increase in the federal funds rate has continued to strengthen but decided, for the time being, to wait for some further evidence of continued progress toward its objectives. The stance of monetary policy remains accommodative, thereby supporting further improvement in labor market conditions and a return to 2 percent inflation."
==========
EUR/USD M5: 29 pips range price movement by Federal Funds Rate news events
==========
USD/CAD M5: 19 pips range price movement by Federal Funds Rate news events
==========
NZD/USD M5: 28 pips range price movement by Federal Funds Rate news events
- Free trading apps
- Over 8,000 signals for copying
- Economic news for exploring financial markets
You agree to website policy and terms of use
Daily price is on located below Ichimoku cloud in the bearish area of the chart. The price was started with the local uptrend as the secondary rally within the primary bearish market condition and with 1.1038 resistance level to be crossed to above for the bear market rally to be continuing.
By the way, the descending triangle pattern was formed by the price to be crossed to below for the bearish trend to be resumed, Trend Strength indicator is estimating the trend as the bearish, but Absolute Strength indicator together with Chinkou Span line of Ichimoku are evaluating the future trend as the bearish with ranging rally.
If D1 price breaks 1.0859 support level on close bar so the primary bearish trend will be resumed with 1.0814 bearish target.If D1 price breaks 1.1038 resistance level on close bar from below to above so the local uptrend as the bear market rally will be continuing.
If D1 price breaks 1.1278 resistance level on close bar from below to above so we may see the reversal of the daily price movement from the ranging bearish to the primary bullish market condition.
If not so the price will be on bearish ranging within the levels.
SUMMARY: bearish
TREND: bear market rally