Indicators: X-bars Fractals
Forum on trading, automated trading systems and testing trading strategies
newdigital, 2013.12.16 11:23
The fractals are technical indicators, part of the Bill Williams’ indicators. Unlike any other indicators, this one is not a line or histogram bars; it is just a simple arrow on top of or below the bars of the price chart. These fractals are formed when five consecutive bars align in a strict manner. There are two types of fractals:
Bearish fractals: this fractal forms over a bar in the price chart, only if the high of this bar is higher than the high of the previous two and next two bars. In real-life trading this fractal indicates a possible bearish movement.
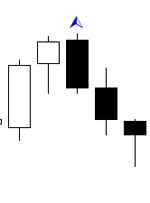
Bullish fractals: this fractal forms below a bar in the price chart, if the low of this bar is lower than the low of the previous two and next two bars. When you see this fractal, you should expect a bullish movement.
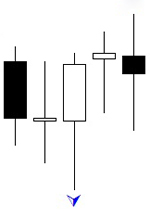
It is important to mention that the Bill Williams’ fractals are illustrated a bit late on the chart, because you need the fifth bar to close, in order to determine the highest high or lowest low. The fractals are trading signals, but they are far too insufficient to count on them alone: the buy fractal indicates a possible buy order and vice versa.
Use in Forex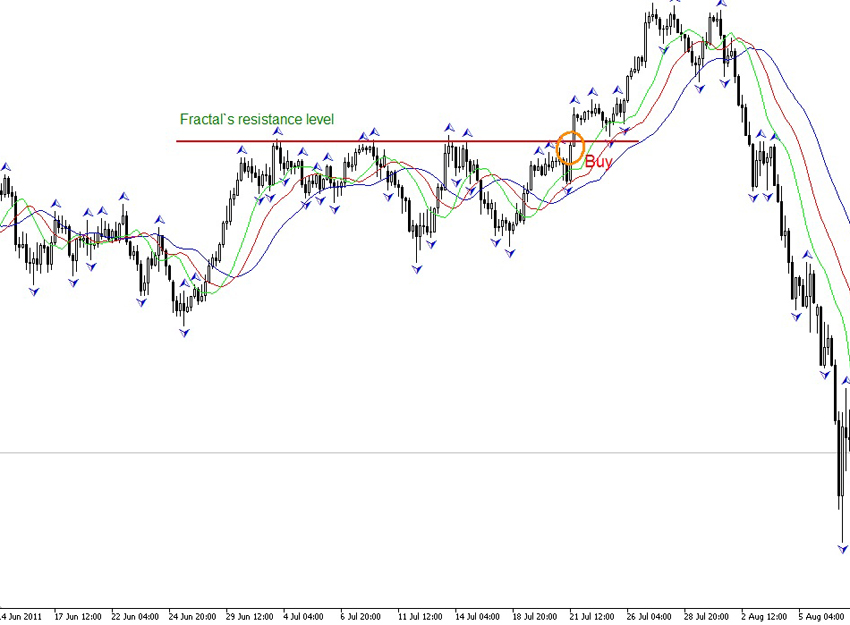
The fractals point out the strong levels. You can easily draw a line to connect multiple fractals to form either a resistance or a support line. These levels work exactly the same as the trend lines. If you take a look at the image, you will see the resistance line and the buy signal. We get this signal, because the price breaks the strong resistance level. However, if you take a close look at the chart before this moment, you will see a couple of sell signals. This clearly points out how inconclusive are the fractals alone.
If you have paid attention on the Trend Lines page, you already know that some traders use the fractals to build their trend line. We really like this strategy, but it is not something revolutionary.
Bill Williams’ fractals and Alligator indicator. These two indicators share great synergy and we will take a quick glance in the image. It is the same as the previous, but we have added the Alligator and this changes the picture quite a lot. Take a look at the buy signal; do you see now why we have not opened a sell order before the buy signal? The price moved above the Alligator and we needed to see a breach of the indicator’s levels and a couple of sell fractals, but did not see that. Instead, the price kept on moving above the Alligator and it even broke the resistance level, which gave us a clear idea of the future movement – buy and take profit.
Forum on trading, automated trading systems and testing trading strategies
Expert Advisors: Exp5-VirtualTradePad for mt5 v 4 (Contest version)
newdigital, 2014.05.10 12:02
The More Intelligent Trailing Stop
- Trailing Stops can reduce risk but increase the chances of being stopped out prematurely.
- Manually trailing our stops each time there is a new swing high/low reduces this whipsaw effect.
- An Asymmetrical Fractal can provide guidance on when to move our stop.
The Flaw in Trailing Stops
Trailing stops are a more advanced type of stop loss order that adjusts itself to a more favorable rate as a trade moves in our favor. The result is a reduced stop loss (reducing risk) that is based solely on how price moves. It is at that moment that a traditional trailing stop shows its flaw. The stop moves to a level based on how far a trade moves in our favor, rather than moving based on key price levels. All support and resistance analysis previously performed is thrown out the window as our stop moves freely to a random level X pips away from the currency pair’s high water mark.
Therefore our stop we set beyond the most recent swing low will suddenly move to a level above the swing low and be at much greater risk of being hit by a sudden downward whipsaw.
Trailing Stop Getting Whipsawed on USD/CNH :
Manual Trailing Stop
So what can we do about trailing stops’ tendency of getting stopped out too early, but still have the benefits of reducing our risk during the life of our trades? The secret is in manually trailing our stop losses ourselves, always basing our stops around support and resistance levels along the way. A rare example of having your cake and eating it too. Let’s take a look.
Manual Trailing Stop in an Uptrend :
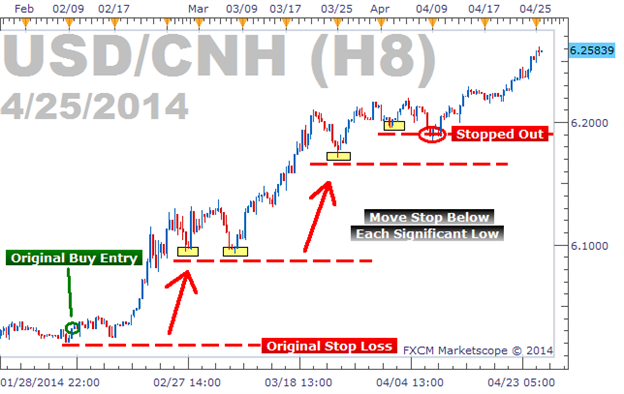
The image above shows the same trade we placed on the USD/CNH, but with much better results. Rather than using a traditional trailing stop that blindly moved up as price moved up, we moved our stop only when a new swing low was created. We set our stop below each new swing low as price progressed and were able to ride this monster uptrend 1500 pips before being stopped out.
It can take some time to be able to “eyeball” significant swing highs and lows and know exactly when a stop should be moved.
The Asymmetrical Fractal
A fractal is a tool that draws an arrow on each candle that’s highest price is higher than the high of the two candles to the left and two candles to the right. It also draws arrows on each candle that’s lowest price is lower than the low of the two candles to the left and two candles to the right. It can be used to note potential turning points in the market, or in this case, can be used to identify swing highs and swing lows that we can base our stop off of.
Some settings will create less fractals than the traditional version due to the stipulation that the candle’s high or low price must be higher or lower than the previous 5 candles and the following 9 candles. Now that we see the asymmetric fractals on our charts, we can see their value immediately. Each time we see a fractal, that is a level where we could manually move our stop since it is a significant swing high or swing low. I’ve overlaid our fractals on to our USD/CNH chart used earlier to show how our manual trailing stop moved almost 100% in sync with the fractals created over the same period:
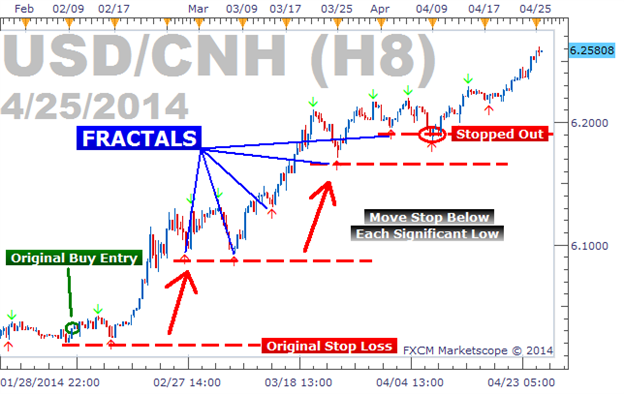
The Buck Stops Where?
Hopefully, this article has given us a better way to trail our stops. We always want our stop to be beyond the most recent swing high or swing low, and the asymmetric fractals can help identify those levels.
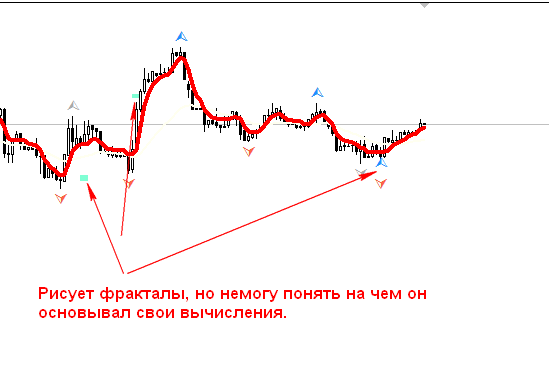
Good day Sergey, there is a question fractals are drawn arbitrarily, I can not understand how to filter out false signals. I marked with squares where there were fractals at one time, but when the chart is updated, they disappear.
Finally, because it's been waiting for 5 years already.

- Free trading apps
- Over 8,000 signals for copying
- Economic news for exploring financial markets
You agree to website policy and terms of use
X-bars Fractals:
The X-bars Fractals indicator allows to set the number of bars on the left and the right from fractal. It is good as for local, so for global extremums.
Author: Serhii Ivanenko