EURUSD Technical Analysis 2016, 16.10 - 23.10: daily bearish to be continuing; weekly breakdown to be started
Forum on trading, automated trading systems and testing trading strategies
Sergey Golubev, 2016.10.15 09:46
Weekly Outlook: 2016, October 16 - October 23 (based on the article)
- Mario Draghi speaks: Monday, 17:35. ECB President Mario Draghi will give a talk in Frankfurt. Market volatility is expected.
- UK Inflation data: Tuesday, 8:30. UK inflation is expected to climb higher to 0.9% in September.
- US Inflation data: Tuesday, 12:30. Economists forecast a 0.3% rise in CPI and a 0.2% gain in core CPI in October.
- UK Employment data: Wednesday, 8:30. The number of unemployed is expected to grow by 3,400 in September.
- US Building permits: Wednesday, 12:30. The number of permits is expected to rise to 1.17 million units this time.
- Canadian rate decision: Wednesday, 14:00.
- US Crude Oil Inventories: Wednesday, 14:30.
- Australian employment data: Thursday, 0:30. The Australian employment market is expected to gain 15,200 jobs in September and the unemployment rate is forecasted to rise to 5.7%.
- Eurozone rate decision: Thursday, 11:45.
- US Philly Fed Manufacturing Index: Thursday, 12:30. Philadelphia region manufacturing index is expected to decline to 5.2 this time.
- US Unemployment Claims: Thursday, 12:30. The number of new claims is expected to reach 251,000 this week.
Forum on trading, automated trading systems and testing trading strategies
Sergey Golubev, 2016.10.15 10:00
EUR/USD Weekly Outlook: 2016, October 16 - October 23 (based on the article)
- CPI (final): Monday, 9:00. The numbers are expected to be confirmed now.
- German PPI: Thursday, 6:00.
- Current Account: Thursday, 8:00.
- EU Economic Summit: Thursday and Friday. Leaders of the European Union convene for a two day summit to discuss economic matters.
- Rate decision: Thursday, rate decision at 11:45, press conference at 12:30.
- Consumer Confidence: Friday, 14:00.
Forum on trading, automated trading systems and testing trading strategies
Sergey Golubev, 2016.10.17 14:46
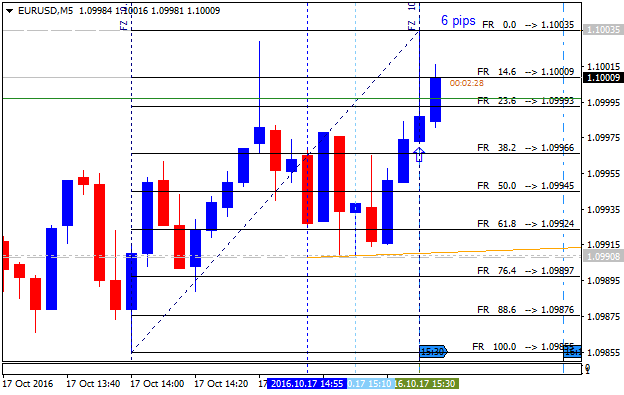
EUR/USD Intra-Day Fundamentals: New York Manufacturing Index and 6 pips price movement
2016-10-17 12:30 GMT | [USD - Empire State Manufacturing Index]
- past data is -2.0
- forecast data is 1.0
- actual data is -6.8 according to the latest press release
if actual > forecast (or previous one) = good for currency (for USD in our case)
[USD - Empire State Manufacturing Index] = Level of a diffusion index based on surveyed manufacturers in New York state.
==========From Market Watch article:
- "A gauge of New York-area manufacturing became more pessimistic in October, data released Monday showed."
- "The Empire State index fell to negative 6.8 from negative 2 in September, on a scale where any reading below zero indicates contracting activity. That’s the weakest reading since May."
- "The index for new orders improved slightly but was still negative at minus 5.6. Orders for shipments, unfilled orders, delivery time, inventories, number of employees and average employee workweek all were negative."
==========
EUR/USD M5: 6 pips price movement by Empire State Manufacturing Index news event
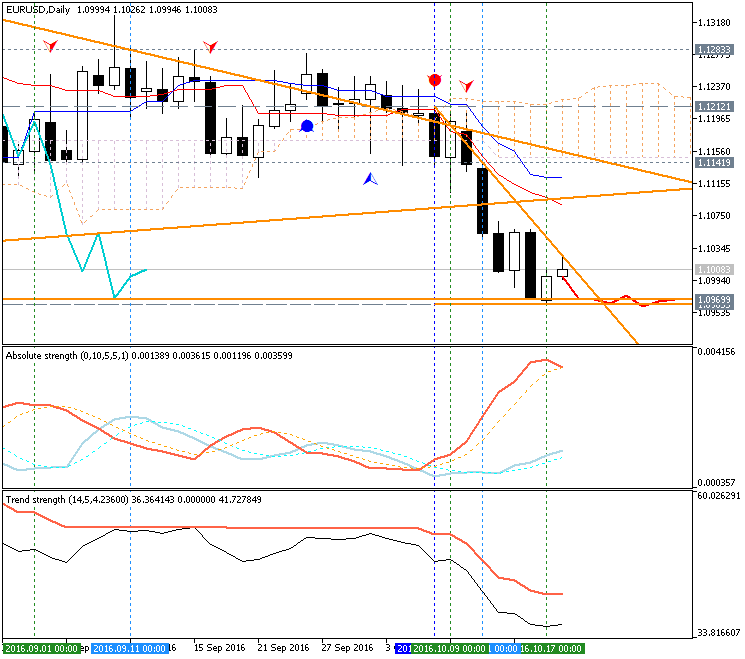
Daily price
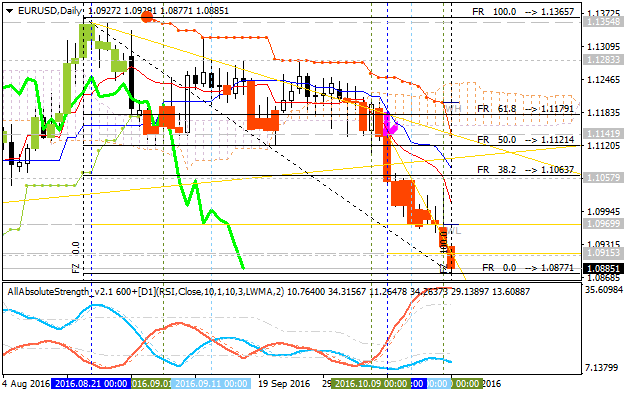
is on primary bearish market condition located below Ichimoku cloud and below Senkou Span line which is the virtual border between the primary bullish and the primary bearish trend on the chart. The price is breaking 1.0985 support level together with descending triangle pattern to below for the bearish trend to be continuing with 1.0911 nearest bearish target to re-enter.
Chinkou Span line is located below the price for the bearish trend to be continuing, Absolute
Strength indicator and Trend Strength indicator are evaluating the trend as a primary bearish market condition in the near future.
If D1 price breaks 1.1238 resistance level on close bar from below to above so the reversal of the daily price movement from the primary bearish to the primary bullish market condition will be started.
If not so the price will be on bearish ranging within the levels.
- Recommendation for long: watch close D1 price to break 1.1238 for possible buy trade
- Recommendation
to go short: watch D1 price to break 1.0911 support level for possible sell trade
- Trading Summary: bearish
| Resistance | Support |
|---|---|
| 1.1238 | 1.0985 |
| 1.1326 | 1.0911 |
SUMMARY : bearish
TREND : breakdown
As we see from the daily chart below - 1.0985 support level was broken today on daily close bar (today's daily bar was opened below 1.0985), and for now - the price is testing 1.0969 support level for the bearish trend to be continuing with 1.0911 weeily bearish target. Otherwise - ranging.
Forum on trading, automated trading systems and testing trading strategies
Sergey Golubev, 2016.10.18 15:02
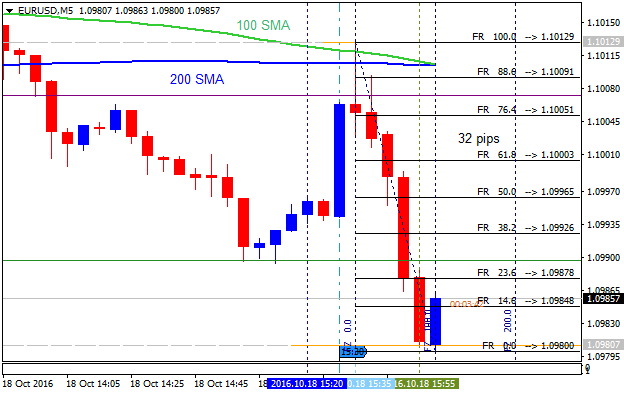
EUR/USD Intra-Day Fundamentals: U.S. Consumer Price Index and 32 pips range price movement
2016-10-18 12:30 GMT | [USD - Consumer Price Index]
- past data is 0.2%
- forecast data is 0.3%
- actual data is 0.3% according to the latest press release
if actual > forecast (or previous one) = good for currency (for USD in our case)
[USD - Consumer Price Index] = Change in the price of goods and services purchased by consumers.
==========From official report:
- "The Consumer Price Index for All Urban Consumers (CPI-U) increased 0.3 percent in September on a seasonally adjusted basis, the U.S. Bureau of Labor Statistics reported today. Over the last 12 months, the all items index rose 1.5 percent before seasonal adjustment."
- "Increases in the shelter and gasoline indexes were the main causes of the rise in the all items index. The gasoline index rose 5.8 percent in September and accounted for more than half of the all items increase. The shelter index increased 0.4 percent, its largest increase since May."
==========
EUR/USD M5: 32 pips range price movement by U.S. Consumer Price Index news event
Forum on trading, automated trading systems and testing trading strategies
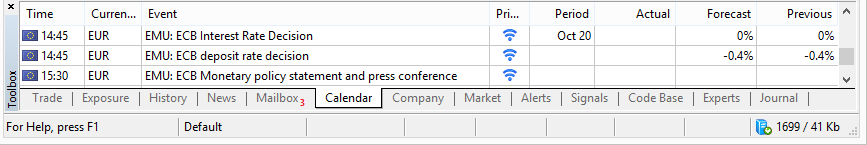
Sergey Golubev, 2016.10.20 10:07
Trading News Events: ECB Minimum Bid Rate (adapted from the article)
- "Even though the European Central Bank (ECB) is widely anticipated to retain its current policy in October, the EUR/USD may face a sharp move should President Mario Draghi & Co. take additional steps to further support the monetary union."
- "After cutting the growth forecast in September, the Governing Council may push out the deadline for its quantitative easing (QE) program and adjust the guidelines of its non-standard measures in an effort to encourage a stronger recovery. However, more of the same from the ECB may trigger a bullish reaction in the single-currency should the central bank stick to the March 2017 deadline for its asset-purchases."
Bearish EUR Trade: Governing Council Extends/Adjusts QE Program
- "Need red, five-minute candle following the policy statement to consider a short EUR/USD trade."
- "If market reaction favors a bearish Euro trade, sell EUR/USD with two separate position."
- "Set stop at the near-by swing high/reasonable distance from cost; need at least 1:1 risk-to-reward."
- "Move stop to entry on remaining position once initial target is met, set reasonable limit."
- "Need green, five-minute candle to favor a long EUR/USD trade."
- "Implement same strategy as the bearish euro trade, just in the opposite direction."
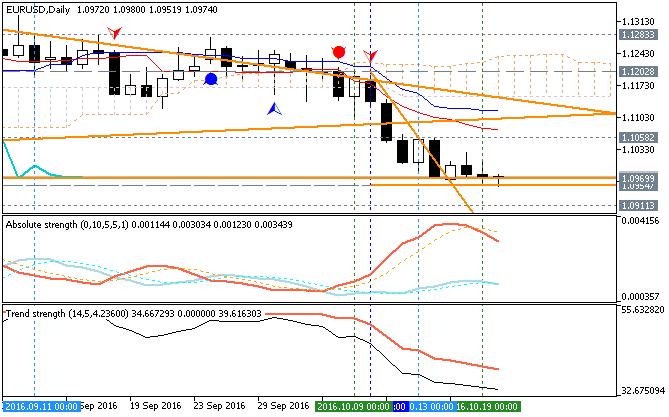
Daily
price
is located below Ichimoku cloud in the bearish area of the chart. The price is testing 1.0969 support level together withdescending triangle pattern to below for 1.0954 nearest bearish target to re-enter.
- If D1 price breaks 1.1058
resistance level to above on
close daily bar so the local uptrend as the bear market rally will be started.
- If price breaks 1.0969
support to below on close daily bar so the primary bearish trend will be resumed with 1.0954 re-enter target.
- If not so the price will be on bearish ranging within the levels.
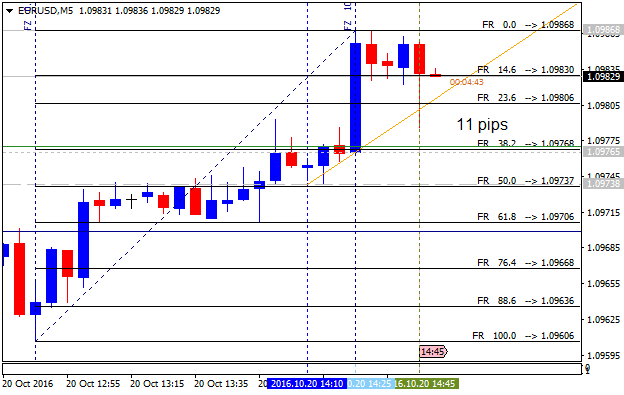
EUR/USD M5: 25 pips range price movement by ECB Minimum Bid Rate news events
Forum on trading, automated trading systems and testing trading strategies
Sergey Golubev, 2016.10.20 15:16
Intra-Day Fundamentals - EUR/USD and USD/CAD : Philadelphia Fed Business Outlook Survey
2016-10-20 12:30 GMT | [USD - Philly Fed Manufacturing Index]
- past data is 12.8
- forecast data is 5.2
- actual data is 9.7 according to the latest press release
if actual > forecast (or previous one) = good for currency (for USD in our case)
[USD - Philly Fed Manufacturing Index] = Level of a diffusion index based on surveyed manufacturers in Philadelphia.
==========
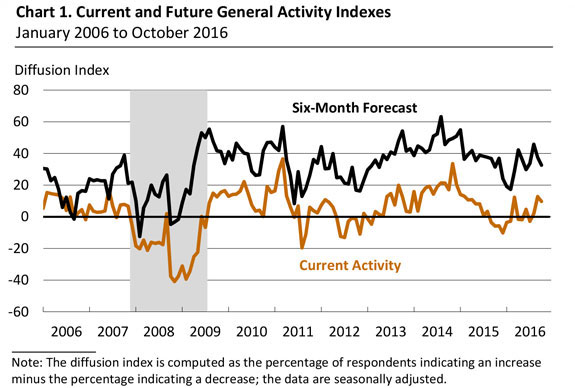
From official report:
"The index for current manufacturing activity in the region edged down,
from a reading of 12.8 in September to 9.7 this month. The index has now
been positive for three consecutive months (see Chart 1). Other broad
indicators showed notable improvement. The new orders index improved
markedly this month, increasing from 1.4 in September to 16.3 in
October. The percentage of firms reporting increases in new orders this
month rose to 40 percent from 30 percent last month. The current
shipments index also improved, rising 24 points to 15.3. The delivery
times, unfilled orders, and inventories indexes remained weak, however,
with all registering negative readings, although they were less negative
than in September."
==========
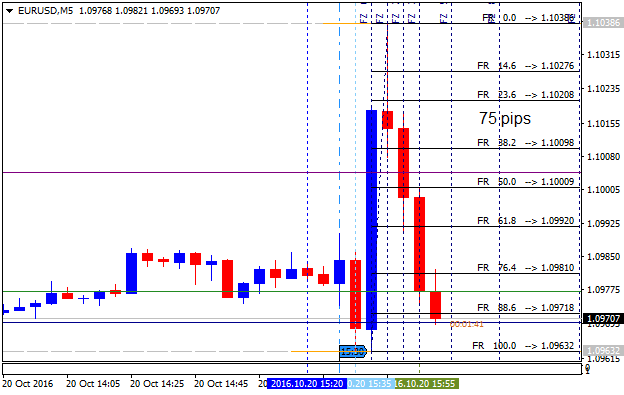
EUR/USD M5: 75 pips range price movement by Philadelphia Fed Business Outlook Survey news events
==========
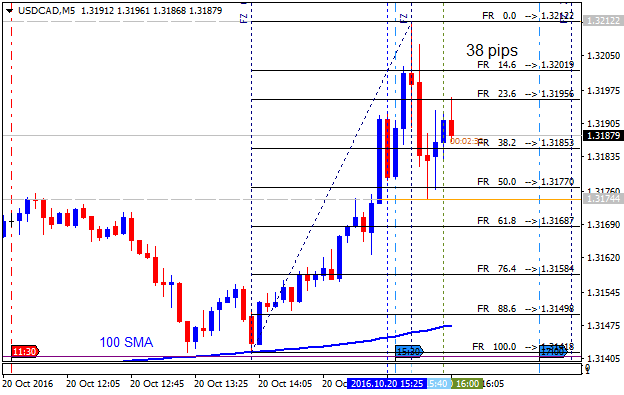
USD/CAD M5: 38 pips range price movement by Philadelphia Fed Business Outlook Survey news events
As we see from the daily chart below - 1.0985 support level was broken today on daily close bar (today's daily bar was opened below 1.0985), and for now - the price is testing 1.0969 support level for the bearish trend to be continuing with 1.0911 weeily bearish target. Otherwise - ranging.
1.0985 level was broken as well on daily close bar. The price is testing 1.0885 support (on D1 close bar to be broken) for the bearish breakdown to be continuing.
So, it was really great breakdown for the week: the price was moved from the following:
- 1.0985 support level estimated for the daily price on Sunday, to
- 1.0885 support for now.
Thus, this is 100 pips price movement from one key support on Sunday/Monday morning to the other one for now.
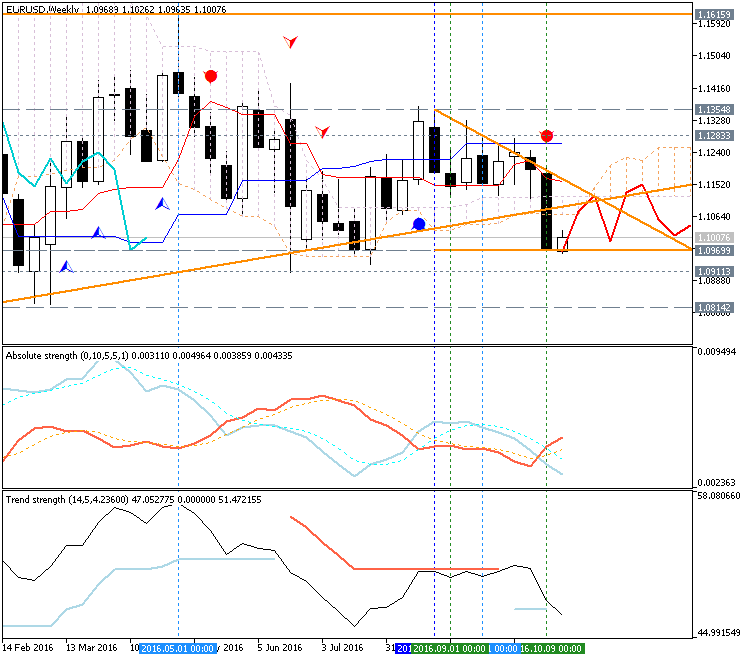
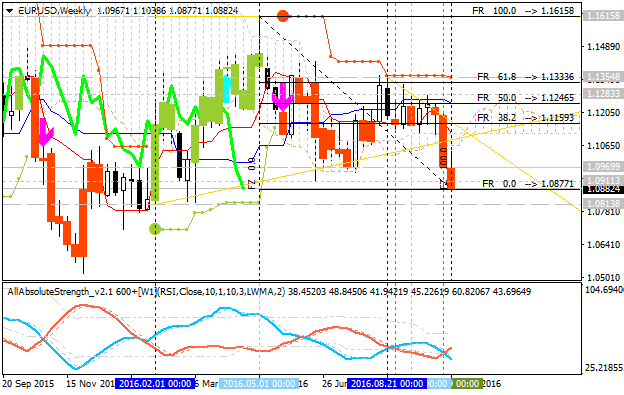
As to the weekly chart (a medium term situation) so this is bearish breakdown is still going on with 1.0877 support level to be broken on close weekly bar for the bearish breakdown to be continuing, otherwise - ranging bearish.
- Free trading apps
- Over 8,000 signals for copying
- Economic news for exploring financial markets
You agree to website policy and terms of use
Daily price is on primary bearish market condition located below Ichimoku cloud and below Senkou Span line which is the virtual border between the primary bullish and the primary bearish trend on the chart. The price is breaking 1.0985 support level together with descending triangle pattern to below for the bearish trend to be continuing with 1.0911 nearest bearish target to re-enter.
Chinkou Span line is located below the price for the bearish trend to be continuing, Absolute Strength indicator and Trend Strength indicator are evaluating the trend as a primary bearish market condition in the near future.
If D1 price breaks 1.0985 support level on close bar so the reversal of the daily price movement from the ranging bullish to the primary bearish market condition will be started with 1.0911 level as a daily bearish target.If D1 price breaks 1.1238 resistance level on close bar from below to above so the reversal of the daily price movement from the primary bearish to the primary bullish market condition will be started.
If not so the price will be on bearish ranging within the levels.
SUMMARY : bearish
TREND : breakdown