Indicators: Candles, arbitrary seconds
After a short period of work, it starts drawing a candle that stands in one place. Logically, this candle should be replaced by several dozens of 3-second candles. What can be the reason?
Are you able to please explain to me the benefits of generated data and how I am able to use the generated data to make profit.
Thank you.
Its lovely work. is there any possibility to apply indicators on it? for example if i want to see the overbought, oversold conditions on that tick/seconds chart.
sober:
After a short period of work, it starts drawing a candle that stands in one place. Logically, this candle should be replaced by several dozens of 3-second candles. What can be the reason?
Good!
fantastic.........
Is it possible to add timer to this indicator? Its hard to follow candles without knowing new bar start and end.
Can you please create a .mqh file for this?
Very talented...Genius! ;)
You are missing trading opportunities:
- Free trading apps
- Over 8,000 signals for copying
- Economic news for exploring financial markets
Registration
Log in
You agree to website policy and terms of use
If you do not have an account, please register
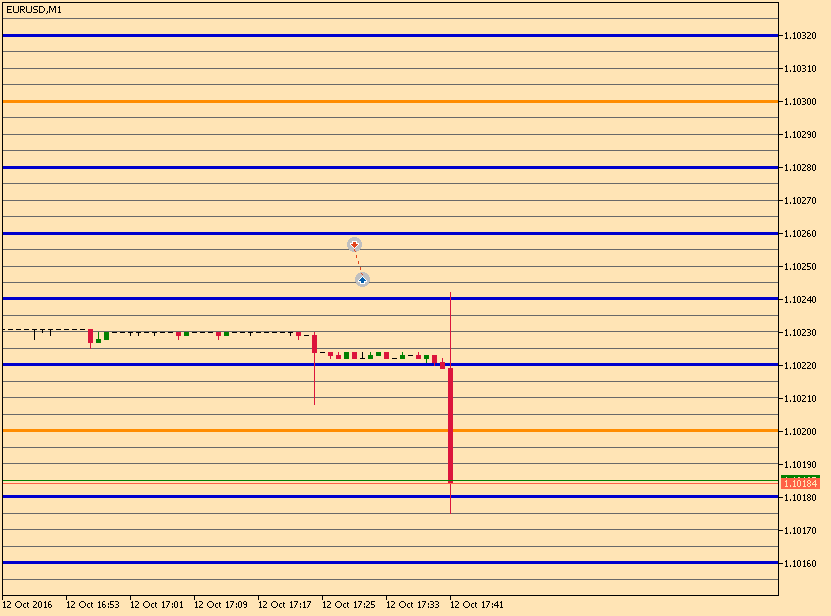
Candles, arbitrary seconds:
This is an indicator that generates simulated data for any period - but in seconds
Author: Automated-Trading