Discussion of article "The Easy Way to Evaluate a Signal: Trading Activity, Drawdown/Load and MFE/MAE Distribution Charts"
There is no very important indicator: mat. expectation on the symbol in pips - MOP.
It is absolutely irrelevant with what purposes the account is traded. Long-term or pipsator.
When copying each trade there is a double loss on slippages + commission. On EURUSD it is about 10 pips. Therefore, if MOP_EURUSD < 10 - immediately reject.
The load graph speaks about such an important factor as the application of man-management. The more competently a trader approaches account management, the lower this indicator is.
The red colour would highlight the information about the load on the subscriber's account from leverage and slippage. This information is important for beginners. Because experienced subscribers do not need this article.
Forum on trading, automated trading systems and testing trading strategies.
fxsaber, 2016.09.24 14:17
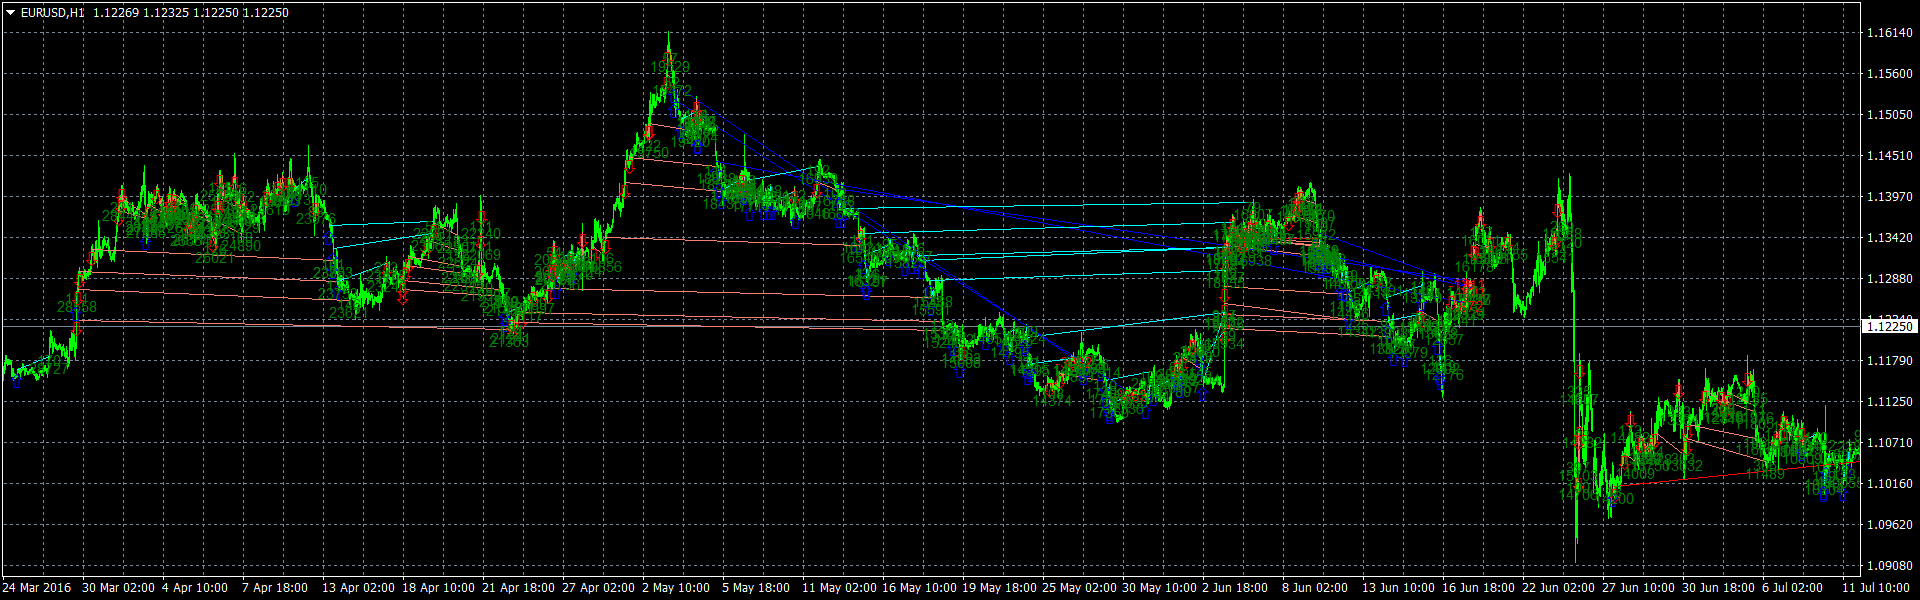
The best way to do this is to use a steith. Here is what the kimov script shows
There is no very important indicator: mat. expectation on the symbol in pips - MOP.
It is absolutely irrelevant with what purposes the account is traded. Long-term or pipsator.
When copying each trade there is a double loss on slippages + commission. On EURUSD it is about 10 pips. Therefore, if Mop_EURUSD < 10 - immediately rejected.
Thank you! I understand!
EXCELLENT ARTICLE!
Everyone involved in forex, especially in expert advisors, should read this.
- Free trading apps
- Over 8,000 signals for copying
- Economic news for exploring financial markets
You agree to website policy and terms of use
New article The Easy Way to Evaluate a Signal: Trading Activity, Drawdown/Load and MFE/MAE Distribution Charts has been published:
Subscribers often search for an appropriate signal by analyzing the total growth on the signal provider's account, which is not a bad idea. However, it is also important to analyze potential risks of a particular trading strategy. In this article we will show a simple and efficient way to evaluate a Trading Signal based on its performance values.
The account balance and equity values of each signal are monitored since the account registration in the Signals service. The difference between these values is positive, if currently open positions show a floating profit. But if the equity is less than the balance value, it means that the trading account is having a drawdown or unrecorded loss.
Author: MetaQuotes Software Corp.