USDCAD Technical Analysis 2016, 11.09 - 18.09: possible bullish reversal on ranging way
Forum on trading, automated trading systems and testing trading strategies
Sergey Golubev, 2016.09.15 15:01
Intra-Day Fundamentals - EUR/USD, USD/CAD and AUD/USD: U.S. Retail Sales and U.S. Philadelphia Fed Business Outlook Survey
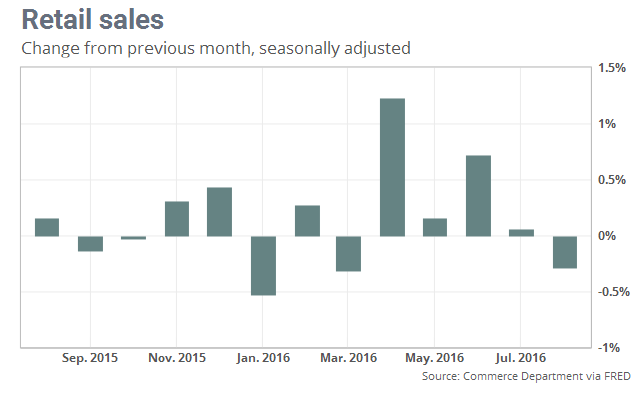
2016-09-15 12:30 GMT | [USD - Retail Sales]
- past data is 0.1%
- forecast data is -0.1%
- actual data is -0.3% according to the latest press release
if actual > forecast (or previous one) = good for currency (for USD in our case)
[USD - Retail Sales] = Change in the total value of sales at the retail level.
==========
==========
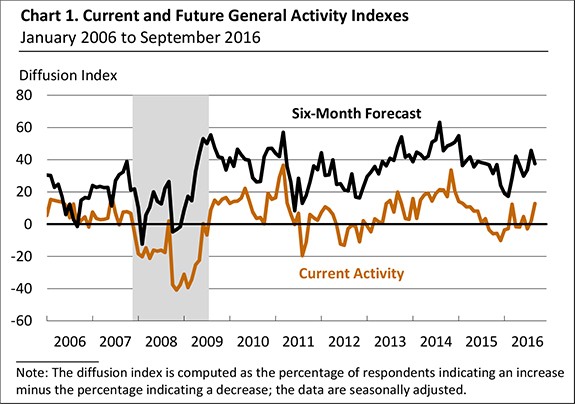
2016-09-15 12:30 GMT | [USD - Philly Fed Manufacturing Index]
- past data is 2.0
- forecast data is 1.1
- actual data is 12.8 according to the latest press release
if actual > forecast (or previous one) = good for currency (for USD in our case)
[USD - Philly Fed Manufacturing Index] = Level of a diffusion index based on surveyed manufacturers in Philadelphia.
==========
==========
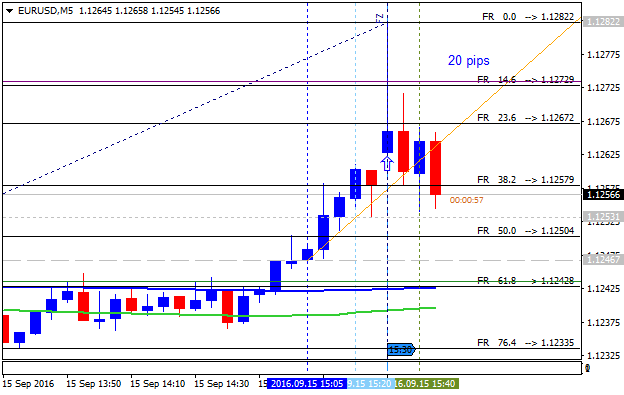
EUR/USD M5: 20 pips price movement by U.S. Retail Sales and Philly Fed Manufacturing Index news events
==========
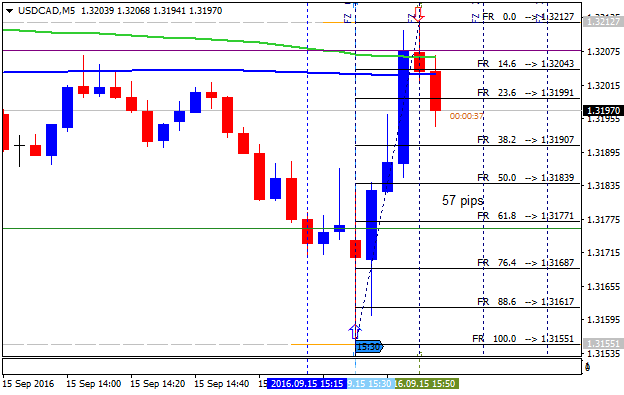
USD/CAD M5: 57 pips range price movement by U.S. Retail Sales and Philly Fed Manufacturing Index news events
==========
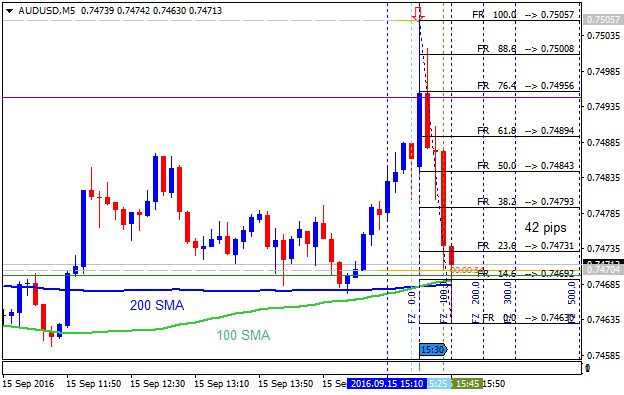
AUD/USD M5: 42 pips range price movement by U.S. Retail Sales and Philly Fed Manufacturing Index news events
Forum on trading, automated trading systems and testing trading strategies
Sergey Golubev, 2016.09.16 14:42
USD/CAD Intra-Day Fundamentals: Canada's Monthly Survey of Manufacturing and 30 pips price movement
2016-09-16 12:30 GMT | [CAD - Manufacturing Sales]
- past data is 0.8%
- forecast data is 0.6%
- actual data is 0.1% according to the latest press release
if actual > forecast (or previous one) = good for currency (for CAD in our case)
[CAD - Manufacturing Sales] = Change in the total value of sales made by manufacturers.
==========
"Manufacturing sales edged up 0.1% in July to $50.7 billion. Higher sales in the food, petroleum and coal products, and primary metals industries were largely offset by a decrease in the production of aerospace product and parts, and by lower machinery sales."
"Overall, sales were up in 9 of 21 industries, representing about 54% of the manufacturing sector. Non-durable goods rose 1.0% to $23.6 billion, while durable goods decreased 0.7% to $27.0 billion."
"Constant dollar sales increased 0.6%, indicating that a higher volume of goods was sold in July."
==========
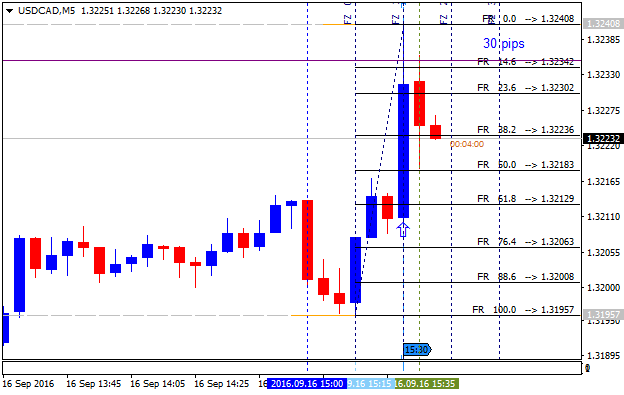
USD/CAD M5: 30 pips price movement by Canada's Monthly Survey of Manufacturing news event
- Free trading apps
- Over 8,000 signals for copying
- Economic news for exploring financial markets
You agree to website policy and terms of use
Daily price is on secondary rally within the primary bullish market condition: price broke one of Senkou Span line B of Ichimoku indicator to above for the ranging rally to be located inside Ichimoku cloud.
- The price is testing Senkou Span A line of
Ichimoku indicator to above together with 1.3113 resistance level to be
reversed to the bullish market condition.
- Chinkou
Span line of Ichimoku indicator is breaking the price to above for the good possible breakout.
- Absolute Strength indicator is estimating the bullish reversal on ranging way in the near future.
If D1 price breaks 1.2822 support level on close bar so the primary bearish trend will be resumed.If D1 price breaks 1.3113 resistance level on close bar from below to above so the reversal of the price movement from the ranging bearish to the primary bullish market condition will be started with 1.3200 level as a nearest daily target to re-enter.
If not so the price will be on bearish ranging within the levels.
SUMMARY : bear market rally
TREND : bearish