just to be clear,
1) yes, i am aware the cloud computing (metatester agents) exists
2) i was expecting the newer pc to be at least 4x times faster:
a) 2x due to 4 vs. 2 cores / 6MB vs. 3MB L3
b) 2x due to frequency/architecture/chipset/faster memory

- cloud.mql5.com
You mean why i7 with 8 threads has half execution time compare to Core 2 Duo with 2 threads ?
Try again without cloud.
this are results without using the cloud.
i wanted to point out that i am aware of cloud testing possibility.
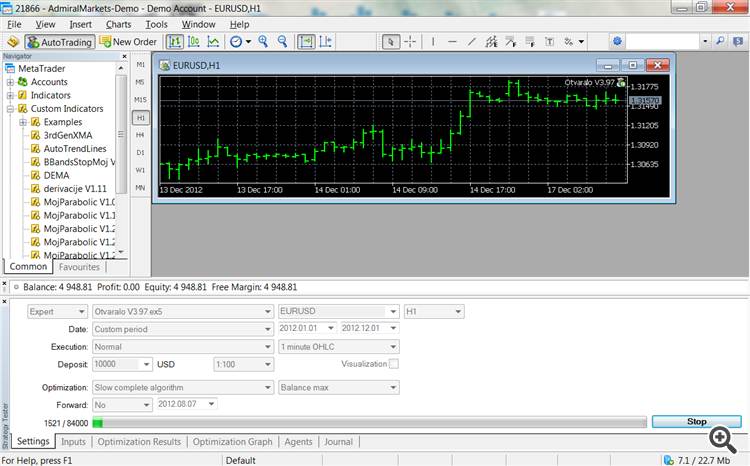
it seems that this is connected to new window which opens when strategy optimization starts.
this window started appearing in build 730, and is here to show that one instance of EA is running, the one that handles OnTesterPass() .
This instance was working also before, but it was hidden.
I cant see ANY reason for showing this window, but i see consequences of this great idea:
1) When you close it, for some reasons optimization slows down
2) OnTesterPass() is not executed anymore (but this is expected)
3) It doesn't close after the testing is finished, so it is making unnecessary mess and confusion
4) if you have more windows open, at one moment you notice that you have a strange terminal window with EA attached to some instrument and wonder what is this and then in panic you close that and few other windows, which you actually need
Luckily, this window doesnt open transactions.
So dear MetaQuotes.... what are you doing?
please, please, please remove this 'feature'.
What window are you talking about? Can you provide a screenshot?
This is normal behavior. As per the documentation:
The OnTesterPass() function is the handler of the TesterPass event, which is automatically generated when a frame is received during Expert Advisor optimization in the strategy tester. The function must be defined with the void type. It has no parameters:
void OnTesterPass(); |
An Expert Advisor with the OnTesterPass() handler is automatically loaded in a separate terminal chart with the symbol/period specified for testing, and gets TesterPass events when a frame is received during optimization. The function is used for dynamic handling of optimization results "on the spot" without waiting for its completion. Frames are added using the FrameAdd() function, which can be called after the end of a single pass in the OnTester() handler.
Yes, i agree, you can see that i understand what is going on.
But this chart DIDN'T appear before. It was invisible.
Is there a way to hide it?
This doesn't work:
void OnTesterPass()
{   ChartSetInteger(ChartID(), CHART_WINDOW_IS_VISIBLE, (long)false);
...
}
And the chart is not closed when the optimization is finished/stoped.
Yes, i agree, you can see that i understand what is going on.
But this chart DIDN'T appear before. It was invisible.
Is there a way to hide it?
This doesn't work:
And it isn't closed when the optimization is finished/stoped.
- Free trading apps
- Over 8,000 signals for copying
- Economic news for exploring financial markets
You agree to website policy and terms of use

interesting info for everyone:
i am running same EA/parameters/period/MT5 build on drastically different hw and i am getting simmilar calculation speed:
i7 3610QM / 8 GB DDR3 1600/ 8 threads -> 44 hours execution time
Core2 Duo T8100 / 2GB DDR3 / 2 threads -> 85 hours execution time
General benchmarks show 8x better performance on 3610QM/T8100. So, something is wrong here :)
i.e. there are obviously some things that need to be considered when running backtests.
i havent done any further testings so far (but i will), at the moment i am considering reducing 8 threads to 4 on i7,
as it has only 6MB L3 cache, probably too little for 8 threads, and there are only 4 cores (extra 4 cores is pure marketing based on hyperthreading).
Any experiences anyone?