EURUSD Technical Analysis 2016, 24.07 - 31.07: daily bearish and weekly bearish reversal with 1.0911 as a target
Forum on trading, automated trading systems and testing trading strategies
Sergey Golubev, 2016.07.25 07:40
Weekly Outlook by Morgan Stanley and EUR/USD Intra-Day Technical Analysis (adapted from the article)
"This week's ECB meeting provided few surprises and did not commit to easing in September. Our view is even if they do cut by 10bps, in line with our economists' expectations, it will not do much for EUR given banking sector weakness and already extremely low yields. The EBA's stress test needs to be watched as it could bring EMU's banking sector back into focus. We still see upside potential for EUR in the medium term on the basis of real yield differentials, and like buying against USD and particularly GBP."
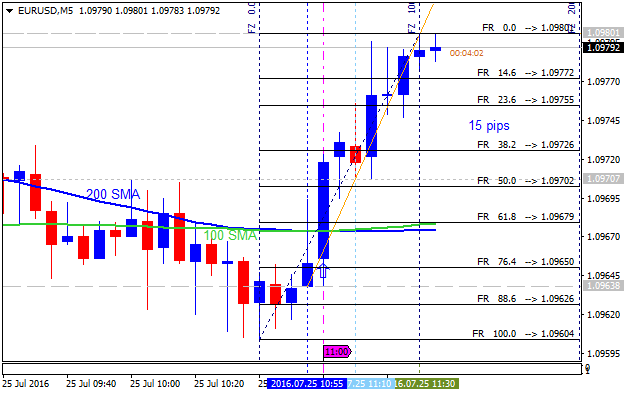
H1 price is located below SMA with period 100 (100 SMA) and below SMA with the period 200 (200 SMA) waiting for the bearish trend to be continuing or to the bear market rally to be started.
- If the price breaks 1.0976 resistance level on close H1 bar so the local uptrend as the bear market rally will be started.
- If the price breaks 1.1040 resistance level on close H1 bar so we may see the bullish reversal of the price movement.
- If H1 price breaks 1.0951 support so the bearish trend will be continuing.
- If not so the price will be ranging within the levels.
| Resistance | Support |
|---|---|
| 1.0976 | 1.0951 |
| 1.1040 | N/A |

- Recommendation to go short: watch the price to break 1.0951 support level for possible sell trade
- Recommendation to go long: watch the price to break 1.1040 resistance level for possible buy trade
- Trading Summary: ranging bearish
SUMMARY : ranging
Forum on trading, automated trading systems and testing trading strategies
Sergey Golubev, 2016.07.25 10:37
EUR/USD Intra-Day Fundamentals: German Ifo Business Climate and and 15 pips price movement
2016-07-25 08:00 GMT | [EUR - German Ifo Business Climate]
- past data is 108.7
- forecast data is 107.5
- actual data is 108.3 according to the latest press release
if actual > forecast (or previous one) = good for currency (for EUR in our case)
[EUR - German Ifo Business Climate] = Level of a composite index based on surveyed manufacturers, builders, wholesalers, and retailers.
==========
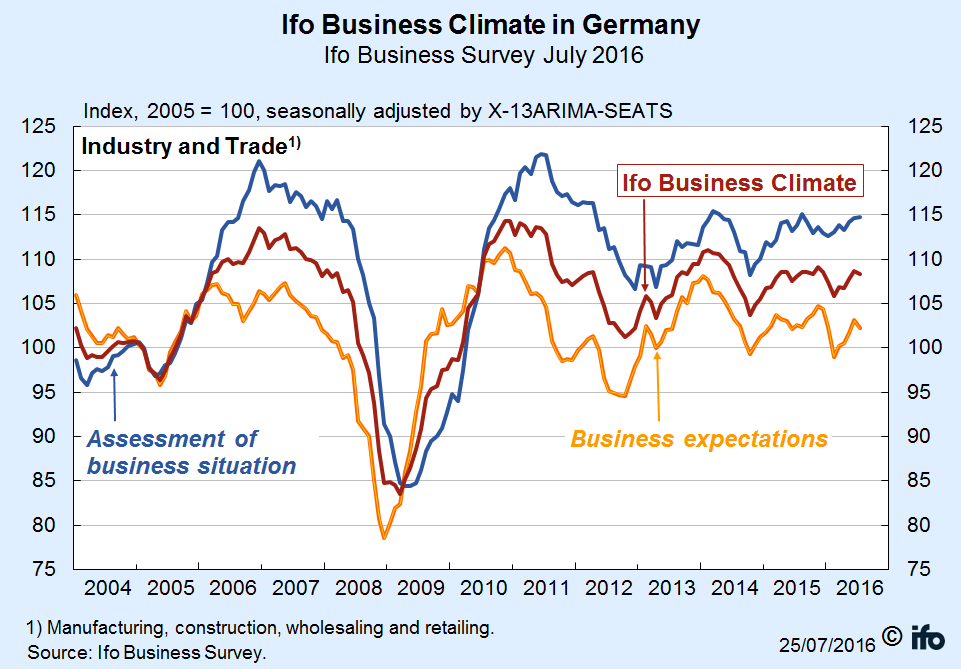
"Sentiment in the German economy weakened slightly in the wake of the Brexit referendum. The Ifo Business Climate Index fell from 108.7 points in June to 108.3 points in July. This was due to far less optimistic business expectations on the part of companies. Assessments of the current business situation, by contrast, improved slightly. The German economy proves resilient."
==========
EUR/USD M5: 15 pips price movement by German Ifo Business Climate news event
Forum on trading, automated trading systems and testing trading strategies
Sergey Golubev, 2016.07.25 13:40
Technical Targets for EUR/USD by United Overseas Bank (based on the article)
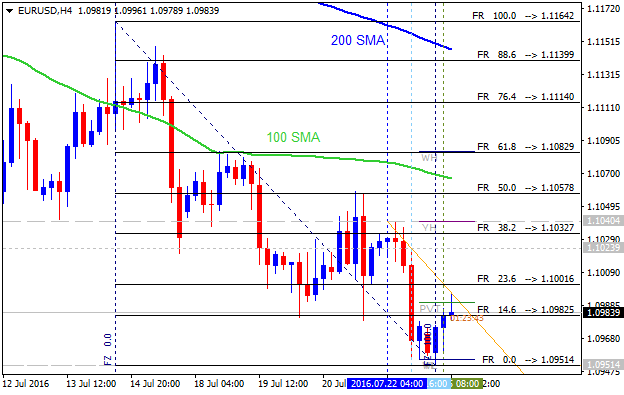
H4 price
is located below 100 SMA/200 SMA on the bearish area of the chart within the following narrow support/resistance
levels:
- 1.1139 resistance level located near 200 SMA in the beginning of the bullish trend to be started, and
- 1.0951 support level located far below 100 SMA/200 SMA area in the primary bearish trend.
Descending triangle pattern was formed by the price to be crossed to below for the bearish trend to be continuing.
Daily
price. United Overseas Bank is considering for EUR/USD for
the bearish market condition to be continuing with 1.0905/10 possible daily target:
"The daily closing below 1.0995 indicates that EUR has started on a move lower to 1.0905/10 (low on the day of Brexit) with decent odds of extending further to 1.0820 (low in early March). The bearish phase just started and in order to maintain the current momentum, any short-term rebound should not move back above 1.1040."
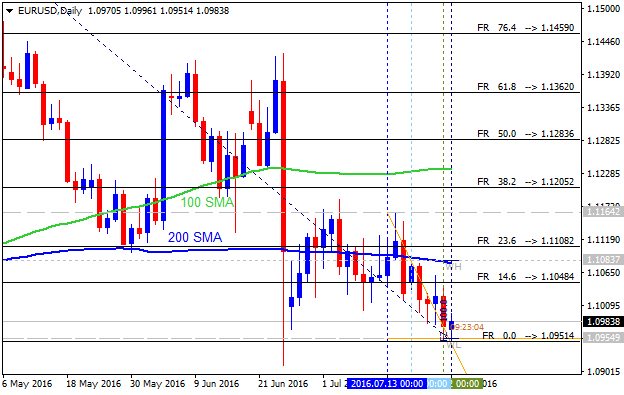
- If daily price breaks 1.1108 resistance level
on close bar so the bullish reversal will be started.
- If daily price breaks 1.0951 support level on close bar so the primary bearish trend will be continuing up to 1.0905/10 bearish target to re-enter.
- If not so the price will be ranging within the levels.
Forum on trading, automated trading systems and testing trading strategies
Sergey Golubev, 2016.07.26 07:40
EUR/USD Daily: Smallest 20 Day Range in 2 Years (based on the article)
"Since the day after the Brexit vote, EUR/USD has been trading in a
fairly tight trading range on low volume. In fact, the highest high to
the lowest low for the past 20 trading days is the tightest range seen
in EUR/USD since August 2014. Beginning June 24 to today, the highest high is 1.1185 and the lowest
low price is 1.0951. Therefore, if price pushes down to 1.0900-1.0951,
we could see some volatility kick up as traders jockey for bullish
support versus a bearish break."
"All of this points towards a market condition geared towards range bound
strategies in EUR/USD until we see a break of the post Brexit range of
1.0951 – 1.1185. Even still, a break of this range doesn’t necessarily
negate the potential for range bound conditions."
Daily price is on bearish ranging within very narrow support/resistance levels:
- 1.0951 support level located below Ichimoku cloud in the bearish area of the chart, and
- 1.1079 resistance level located below Ichimoku cloud in the beginning of the bear market rally to be started.
Descending triangle pattern was formed by the price to be crossed to below for the bearish trend to be continuing/
If the price breaks 1.0951 support level to below on daily close bar so the primary bearish trend will be continuing with 1.0911 bearish target to re-enter.
If the price breaks 1.1079 resistance level to above on daily close bar so the local uptrend as the bear market rally will be started.
If the price breaks 1.1164 resistance level to above so we may see the bullish reversal to be started on this timeframe.
Forum on trading, automated trading systems and testing trading strategies
Sergey Golubev, 2016.07.26 13:10
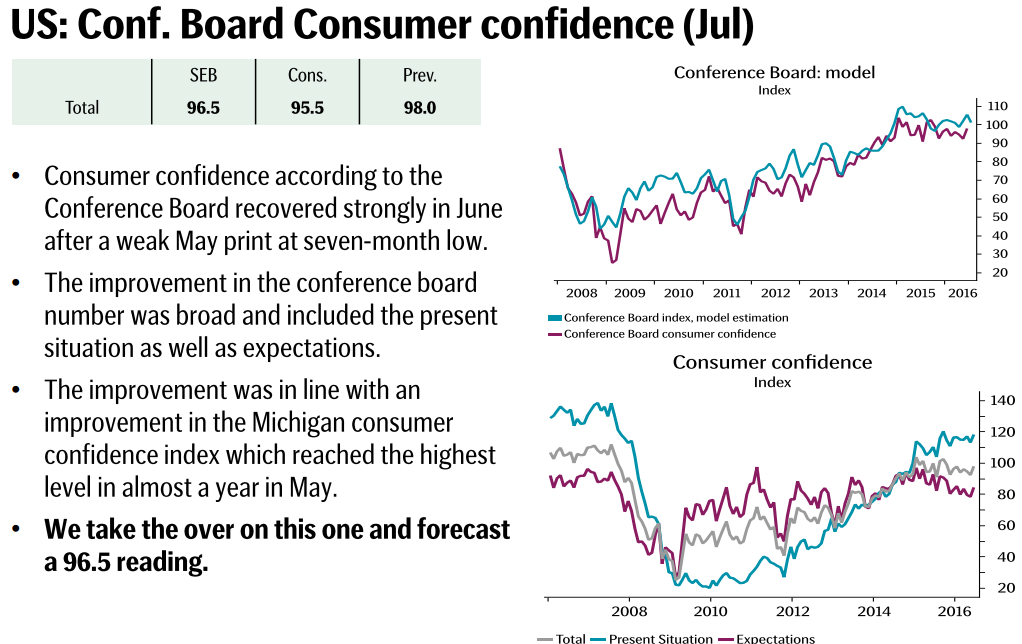
Trading News Events: The Conference Board Consumer Confidence
2016-07-26 14:00 GMT | [USD - CB Consumer Confidence]
- past data is 98.0
- forecast data is 95.5
- actual data is n/a according to the latest press release
if actual > forecast (or previous one) = good for currency (for USD in our case)
[USD - CB Consumer Confidence] = Level of a composite index based on surveyed households.
==========
What’s Expected:
From the article:
==========
EUR/USD H1: bullish ranging near bearish reversal. The price is on ranging near and above Ichimoku cloud within the following key reversal support/resistance levels:
- 1.0985 support level located below Ichimoku cloud and near Senkou Span line in the beginning of the bearish trend to be resumed, and
- 1.1029 resistance level located above Ichimoku cloud in the bullish area of the chart.
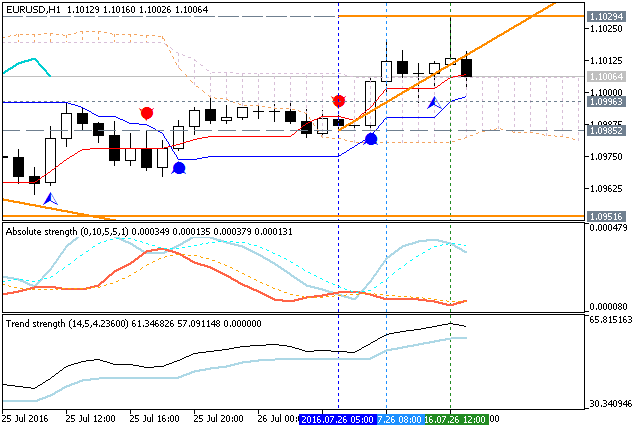
If the price breaks 1.1029 resistance to above on close H1 bar so the bullish reversal will be continuing.
If not so the price will be continuing with the ranging within the levels.
| Resistance | Support |
|---|---|
| 1.1029 | 1.0985 |
| N/A | 1.0951 |
=========
AUD/USD H1: ranging for the bullish continuation or for the bearish reversal. The price is located above Ichimoku cloud in the bullish area of the chart for the ranging within the following key reversal support/resistance levels:
- 0.7582 support level located near and below Ichimoku cloud in the beginning of the bearish trend to be started, and
- 0.7537 resistance level located above Ichimoku cloud in the bullish area of the chart.
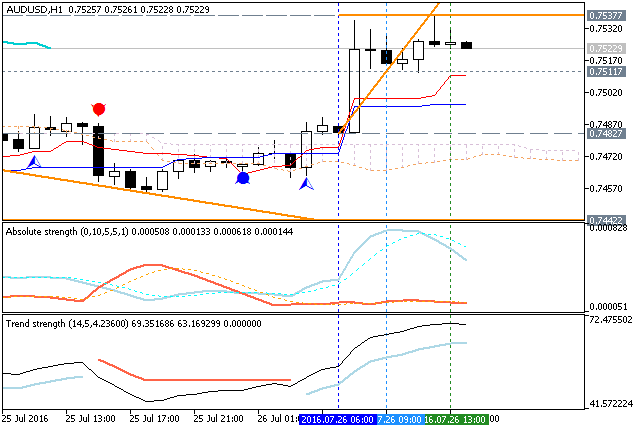
If the price breaks 0.7537 resistance to above on close H1 bar so the bullish reversal will be continuing.
If not so the price will be continuing with the ranging within the levels.
| Resistance | Support |
|---|---|
| 0.7537 | 0.7582 |
| N/A | 0.7582 |
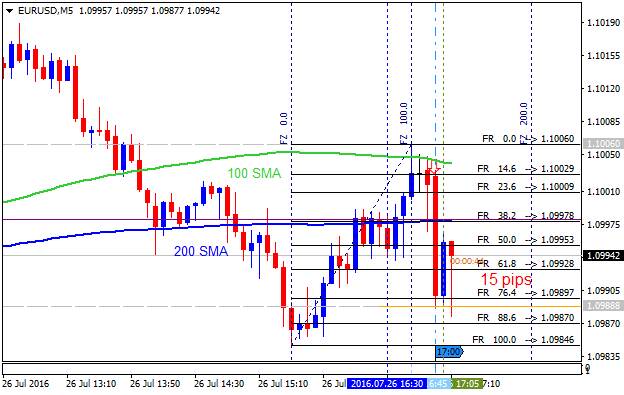
EUR/USD M5: 15 pips price movement by CB Consumer Confidence news event
Forum on trading, automated trading systems and testing trading strategies
Sergey Golubev, 2016.07.27 14:48
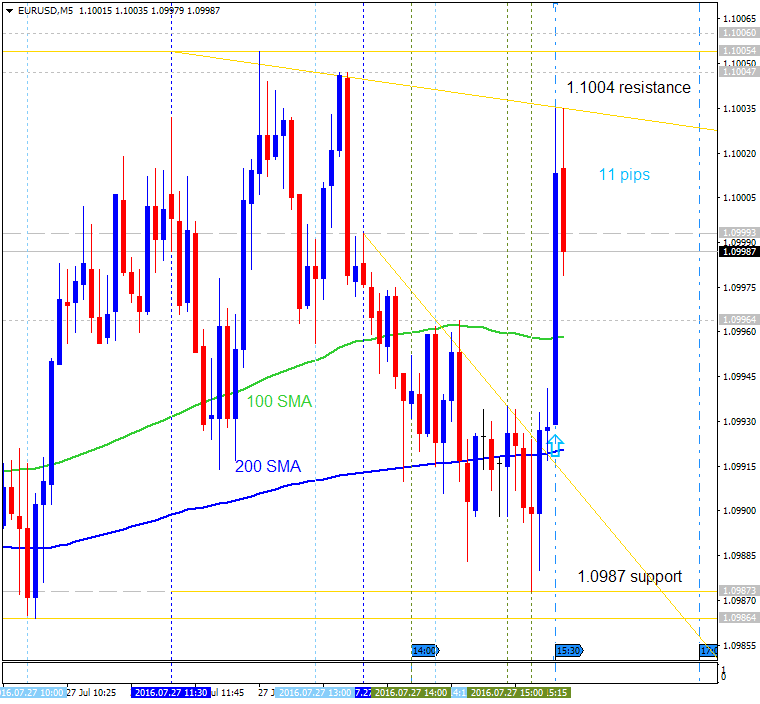
EUR/USD Intra-Day Fundamentals: U.S. Durable Goods Orders and 11 pips range price movement
2016-07-27 12:30 GMT | [USD - Durable Goods Orders]
- past data is -2.3%
- forecast data is -1.1%
- actual data is -4.0% according to the latest press release
if actual > forecast (or previous one) = good for currency (for USD in our case)
[USD - Durable Goods Orders] = Change in the total value of new purchase orders placed with manufacturers for durable goods.
==========
From rttnews article:
- "New orders for U.S. manufactured durable goods fell by much more than expected in the month of June, according to a report released by the Commerce Department on Wednesday."
- "The report said durable goods orders tumbled by 4.0 percent in June following a revised 2.8 percent decrease in May."
- "Economists had expected durable goods orders to dip by 1.3 percent compared to the 2.2 percent decline originally reported for the previous month."
- "Excluding orders for transportation equipment, durable goods orders edged down by 0.5 percent in June after slipping by 0.4 percent in May. Ex-transportation orders had been expected to rise by 0.3 percent."
==========
EUR/USD M5: 11 pips range price movement by U.S. Durable Goods Orders news event
Forum on trading, automated trading systems and testing trading strategies
Sergey Golubev, 2016.07.27 17:55
Trading News Events: Federal Open Market Committee Interest Rate Decision (adapted from the article)
2016-07-27 18:00 GMT | [USD - Federal Funds Rate]
- past data is 0.50%
- forecast data is 0.50%
- actual data is n/a according to the latest press release
if actual > forecast (or previous one) = good for currency (for USD in our case)
[USD - Federal Funds Rate] = Interest rate at which depository institutions lend balances held at the Federal Reserve to other depository institutions overnight.
==========
What’s Expected:
Why Is This Event Important:
"With Fed Funds Futures reflecting limited expectations for higher
borrowing-costs in 2016, Chair Janet Yellen and Co. may largely endorse a
wait-and-see approach for monetary policy as the central bank argues
market-based measures of inflation compensation remains weak while ‘most
survey-based measures of longer-term inflation expectations are little
changed, on balance, in recent months.’"
- "The diverging paths for monetary policy continues to cast a long-term
bearish outlook for EUR/USD, but the pair may mount a larger recovery
over the days ahead amid the string of failed attempts to close below
1.0960 (23.6% retracement) to 1.0970 (38.2% retracement)"
- Key Resistance: "1.1760 (61.8% retracement) to 1.1810 (38.2% retracement)."
- Key Support: "Interim Support: 1.0380 (78.6% expansion) to 1.0410 (61.8% expansion)."
- Bearish trade: "Need green, five-minute candle following the rate decision to consider a long EUR/USD position."
- Bullish trade: "Need red, five-minute candle to favor a short EUR/USD trade."
==========
EUR/USD H1: bearish reversal. The price broke Ichimoku cloud to below for the possible bearish reversal with 1.0984 support level to be testing for the bearish trend to be started. The price is located now within the following support/resistance levels:
- 1.0984 support level located below Ichimoku cloud and near Senkou Span line in the beginning of the bearish trend, and
- 1.1007 resistance level located above Ichimoku cloud in the beginning of the primary bullish trend on the chart.
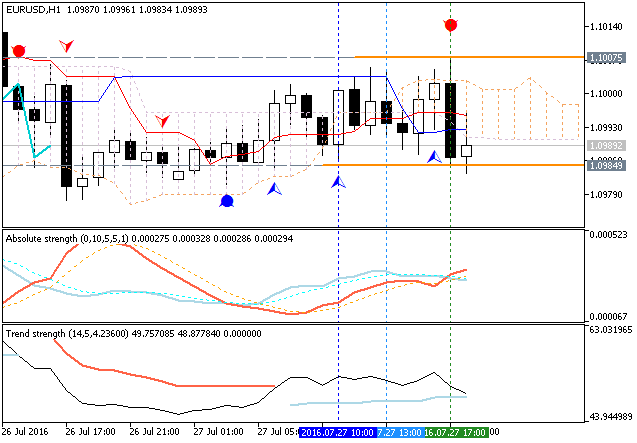
If the price breaks 1.1007 resistance to above on close H1 bar so we may see the reversal of the price movement to the bullish market condition.
If not so the price will be continuing with the ranging within the levels.
| Resistance | Support |
|---|---|
| 1.1007 | 1.0984 |
| N/A | N/A |
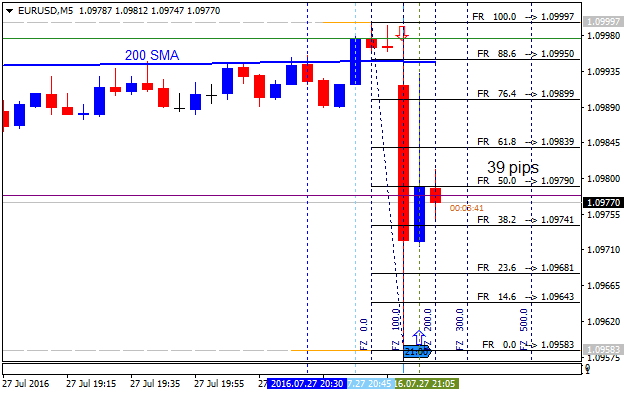
EUR/USD M5: 39 pips range price movement by Federal Open Market Committee Interest Rate Decision news event
Forum on trading, automated trading systems and testing trading strategies
Asif Naveed, 2016.07.27 19:00
Good evening everyone, I hope you had a great day so far! During the last days the market was moving really slowly. Most of the time we saw sideways moves in small ranges and no clear direction. It really seems like the EUR/USD felt asleep and all the big boys are on holidays. Also the Core Durable Goods Orders and Pending Home Sales could not really change that.
It really seems like everyone is waiting for the FOMC Statement and the Fed Interest Rate Decision in the evening. It is not unusual that the market stay rather quiet before bigger events so better be prepared for explosive movements in the evening.
As always it is better to expect all and nothing at once! Set SLs far away for the next hours and then watch the 'game' :)
I wish you all good luck and a nice rest of the day!
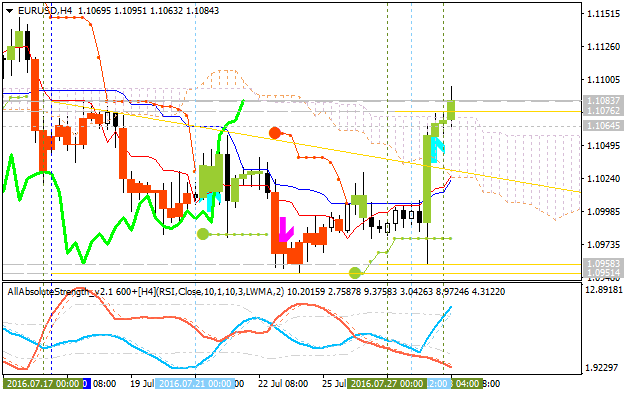
Just interesting situation is going on for this pair so let's describe it in very short way.
---------
EUR/USD H4. Bullish breakout. The price broke Ichimoku cloud and Senkou Span line for the bullish reversal: price is breaking 1.1076/83 resistance levels to above for the bullish trend to be continung. If not so the price will be on ranging within Ichimoku cloud for direction.
EUR/USD D1. Bear market rally. The price is located below Ichimoku cloud in the bearish area of the chart. Price is breaking 1.1064 resistance level to above on close daily bar for the secondary rally within the primary bearish trend to be started. Chinkou Span line is located near and below the price to eb ready for the possible breakout, and Absolute Strength indicator is evaluating the future trend as a ranging rally within the bearish condition.
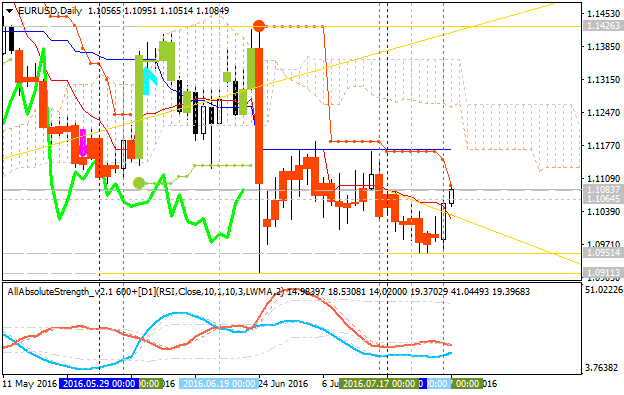
Most likely scenarios: rally to be started with good breakout way, otherwise - bearish ranging.
Forum on trading, automated trading systems and testing trading strategies
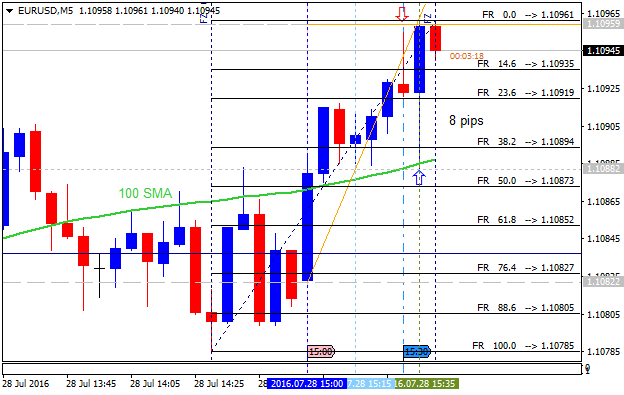
Sergey Golubev, 2016.07.28 14:43
EUR/USD Intra-Day Fundamentals: U.S. Jobless Claims and 8 pips range price movement
2016-07-28 12:30 GMT | [USD - Unemployment Claims]
- past data is 252K
- forecast data is 261K
- actual data is 266K according to the latest press release
if actual < forecast (or previous one) = good for currency (for USD in our case)
[USD - Unemployment Claims] = The number of individuals who filed for unemployment insurance for the first time during the past week.
==========
From CNBC article:
- "The number of Americans filing for unemployment benefits rose more than expected last week, but the underlying trend continued to point to sustained labor market strength."
- "Initial claims for state unemployment benefits increased 14,000 to a seasonally adjusted 266,000 for the week ended July 23, the Labor Department said on Thursday. Claims for the prior week were revised to show 1,000 fewer applications received than previously reported."
- "Economists polled by Reuters had forecast initial claims rising to 260,000 in the latest week. Claims have now been below 300,000, a threshold associated with a healthy labor market, for 73 consecutive weeks, the longest stretch since 1973."
==========
EUR/USD M5: 8 pips range price movement by U.S. Jobless Claims news event
- Free trading apps
- Over 8,000 signals for copying
- Economic news for exploring financial markets
You agree to website policy and terms of use
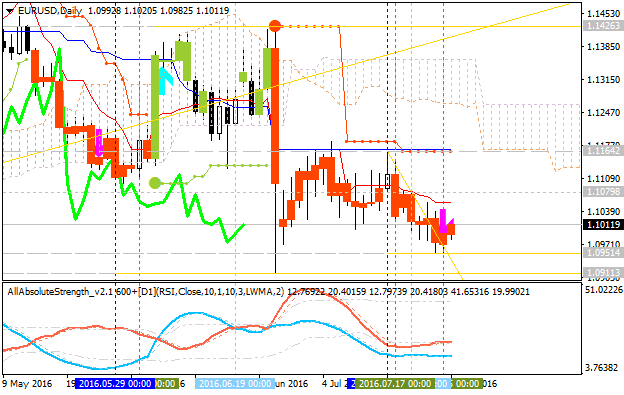
Daily price is located below Ichimoku cloud and Senkou Span line which is the virtual border between the primary bearish and the primary bullish trend on the chart. The price is breaking 1.0979 support level to below for the bearish trend to be continuing with 1.0911 level as a nearest target to re-enter. Descending triangle pattern was formed by the price to be break for the downtrend, and Absolute Strength and Trend Strength indicators are estimating the bearish trend to be continuing on the future.
If D1 price breaks 1.0911 support level on close bar so the bearish trend will be continuing up to bottom to be formed.If D1 price breaks 1.1164 resistance level on close bar from below to above so the reversal of the price movement to the primary bullish market condition will be started.
If not so the price will be on ranging bearish within the levels.
SUMMARY : possible bearish breakdown
TREND : bearish