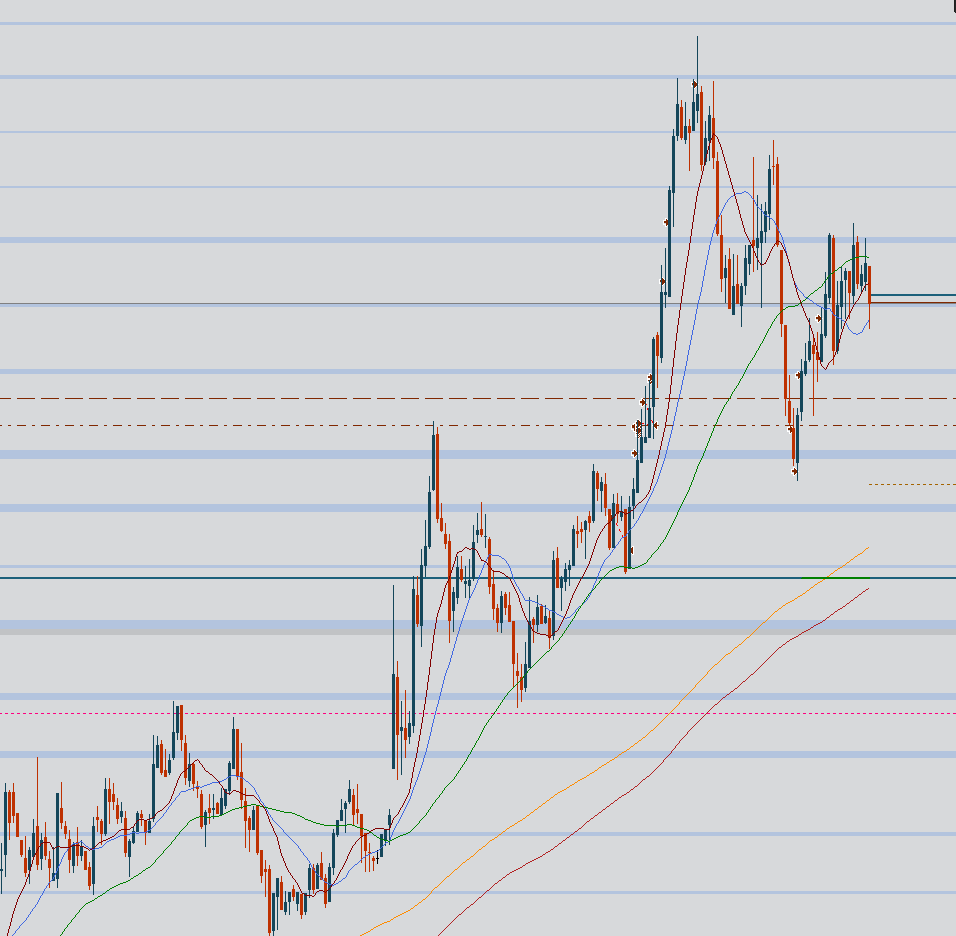
Price floors ( costom support resistance indicator ), anyone have something similar like in this image:
Nevermind ... already created it in c++ :P
In case anyone needs it, here's a code to help.
I hope it helps, its kinda messy
I'm sorry ...
char DCdir(double open1, double close2)
{
        if (close2 > open1) return 1;
        return -1;
}

double DChighest(double open, double close)
{
        if (open > close) return open;
        return close;
}

double DClowest(double open, double close)
{
        if (open > close) return close;
        return open;
}

char DCdiff(double dif)
{
        if (dif == 0) return 0;
        if (dif > 0) return 1;
        return -1;

}

char DCdomdir(double open1, double open2, double high1, double high2, double low1, double low2, double close1, double close2)
{

        char dif = 0;
        dif += DCdiff(DChighest(open2, close2) - DChighest(open1, close1));
        dif += DCdiff(DClowest(open2, close2) - DClowest(open1, close1));
        dif += DCdiff(high2 - high1);
        dif += DCdiff(low2 - low1);

        if (!dif) return 0;
        if (dif > 0) return 1;
        return -1;
}

char DCdomdir2(double open1, double open2, double high1, double high2, double low1, double low2, double close1, double close2)
{

        double d = (high2 - low2) / (high1 - low1);
        if (d > 0.6 && d < 1.4) return 0;

        char dif = 0;
        dif += DCdiff(DChighest(open2, close2) - DChighest(open1, close1));
        dif += DCdiff(DClowest(open2, close2) - DClowest(open1, close1));
        dif += DCdiff(high2 - high1);
        dif += DCdiff(low2 - low1);

        if (!dif) return 0;
        if (dif > 0) return 1;
        return -1;
}

double noneg(double in)
{
        if (in < 0.0) return in * -1.0;
        return in;
}


#define pf_count 3
#define pf_price_dist 30.0
#define pf_time_dist 5;
#define pf_pointsize 0.00001

struct pf
{
        int time; // time position
        double price; // price position
        int count; // for avarage
};

class pricefloors
{
public:
        vector<pf> min;
        vector<pf> max;

        void putmax(double in, int time)
        {
                for (int a = 0; a < max.size(); a++)
                {
                        if (max[a].price - in > pf_pointsize * -pf_price_dist && max[a].price - in < pf_pointsize * pf_price_dist)
                        {
                                max[a].price += (in - max[a].price) / (double)max[a].count;
                                max[a].count++;
                                return;
                        }
                }
                if (max.size() >= 3) return;
                pf to;
                to.count = 1;
                to.price = in;
                to.time = time;
                max.push_back(to);
        }

        void putmin(double in, int time)
        {
                for (int a = 0; a < min.size(); a++)
                {
                        if (min[a].price - in > pf_pointsize * -pf_price_dist && min[a].price - in < pf_pointsize * pf_price_dist)
                        {
                                min[a].price += (in - min[a].price) / (double)min[a].count;
                                min[a].count++;
                                return;
                        }
                }
                if (min.size() >= 3) return;
                pf to;
                to.count = 1;
                to.price = in;
                to.time = time;
                min.push_back(to);
        }

        bool put(int time, double in, double current)
        {
                if (min.size() >= 3 && max.size() >= 4) return true;
                if (in > current) putmax(in, time);
                else putmin(in, time);
                return false;
        }

        void reset()
        {
                min.clear();
                max.clear();
        }
        pricefloors() {
        }
        ~pricefloors() {}
};

void EXP SpPushCandles(long long *time, double *open, double *high, double *low, double *close, int size, int id, long long *volume)
{
        sid(id)->Object->DeleteAll = 1;
        char olddir = DCdir(open[0], close[1]);
        char newdir = 0;

        double *ind = new double[size];
        pricefloors f;
        f.reset();
        for (int a = 0; a < size - 1; a++)
        {
                ind[a] = 0.0;
                newdir = DCdir(open[a], close[a + 1]);
                if (olddir != newdir)
                {
                        spchar n(32);
                        n.add("line");
                        n.addint(a);
                        char dcdom = DCdomdir2(open[a], open[a + 1], high[a], high[a + 1], low[a], low[a + 1], close[a], close[a + 1]);
                        if (olddir != dcdom)
                        {

                                if (newdir > 0) ind[a] = low[a + 1];
                                else ind[a] = high[a + 1];
                                olddir = newdir;
                                continue;
                        }
                }
        }

        for (int a = size - 2; a >= 0; a--) {
                if (!ind[a]) continue;
                if (f.put(time[a], ind[a], close[size - 1])) break;
        }

        cout << "cmin:" << f.min.size() << endl;
        cout << "cmax:" << f.max.size() << endl;
        for (int a = 0; a < f.max.size(); a++)
        {
                spchar n(32);
                n.add("linemax");
                n.addint(a);
                sid(id)->Object->Create(n, f.max[a].time, f.max[a].price, f.max[a].time, f.max[a].price, 255, 0, 0, 6);
        }

        for (int a = 0; a < f.min.size(); a++)
        {
                spchar n(32);
                n.add("linemin");
                n.addint(a);
                sid(id)->Object->Create(n, f.min[a].time, f.min[a].price, f.min[a].time, f.min[a].price, 0, 0, 255, 6);
        }

        delete[] ind;
}
I would like to see the result. This is an algorithm that works. And of course the blue lines were already there before the candles appeared.
Just wonder...
Support/resistance is pretty subjective - i.e. different people draws them at different levels (at least as far as I can see it). What is the logic behind such indicators?
And I will give you an example of how to trade this. The pictures show the German DAX (M1). I simply wait for a reaction at these lines after a bigger move, then I open a position. The lines tell me exactly where I have to put my Stop Loss - never onto such a line, because the price moves almost always exactly between the lines - , as well where I can start to trail: Below the next thicker line and close to it (visualized by the dotted golden line).
As you see, it works very accurate. And if this is not an edge, then I don´t know what an edge is.
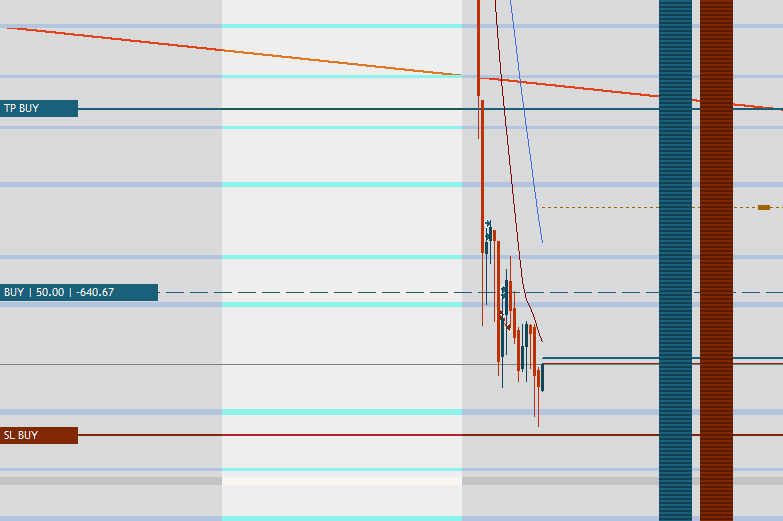

And to complete the picture, this is how it ended. It reacted exactly after the trail started, exactly at the next line and exactly as assumed.
Without these lines, I would either have been stopped out earlier or I had no idea where the peak to take the profit will be. Even if it may not sound very serious, but in the most cases I know it upfront and I proved this many times in several trading forums. This accuracy of what this algorithm produces is surely extraordinary.
Unfortunately no one posted a result of the free-code above, I would really like to compare.
- Free trading apps
- Over 8,000 signals for copying
- Economic news for exploring financial markets
You agree to website policy and terms of use
Does anyone have the indicator what creates those lines like in picture:
The color thing is not important, I made them manually.
I was hoping to represent lines what are higher than current price, yellow and ones what are lower, blue.
Thanks!