Thank you for this Interesting article.
Using a file to buffer data was it mandatory ?
Was not it possible to buffer history data in memory, using statis array ?
Regards
Good afternoon!
I would like to see second charts - a candle is a few seconds (5 sec, 6 sec, 10, 12,15). To see price changes in relation to time.
A typo?
In the text of the article. In the example, it's correct, AskBufferGood day!
Is it possible to use the tick files received by the proposed indicator for multicurrency testing in the tester, while disabling the creation of virtual ticks in the tester and making synchronisation of data on instrument prices by time?
Thank you.

- www.mql5.com
Good afternoon!
I would like to see second charts - a candle is a few seconds (5 sec, 6 sec, 10, 12,15). To see price changes in relation to time.
Good afternoon!
Is it possible to use the tick files received by the proposed indicator for multicurrency testing in the tester, while disabling the creation of virtual ticks in the tester and making synchronisation of data on instrument prices by time?
Thank you.
The files with quotes created by the indicator, of course, can be used for other purposes. I suggest you to disable unnecessary functions (for example, drawing charts) and data processing (for example, synchronisation of data of different instruments). By the way, in my opinion, it is easier to write quotes to a file with the help of such an Expert Advisor (it is also in the attached file):
int h;
void OnInit()
  {
   string s;
   StringConcatenate(s,Symbol(),".txt");
   h=FileOpen(s,FILE_READ|FILE_WRITE|FILE_ANSI|FILE_SHARE_READ);
   FileSeek(h,0,SEEK_END);
  }

void OnTick()
  {
   string s;
   StringConcatenate(s,TimeCurrent(),"  ",DoubleToString(SymbolInfoDouble(Symbol(),SYMBOL_BID),_Digits)," ",DoubleToString(SymbolInfoDouble(Symbol(),SYMBOL_ASK),_Digits));
   FileWrite(h,s);
   FileFlush(h);
  }

void OnDeinit(const int reason)
  {
   FileClose(h);
  }
Great article, thanks for the indicators!
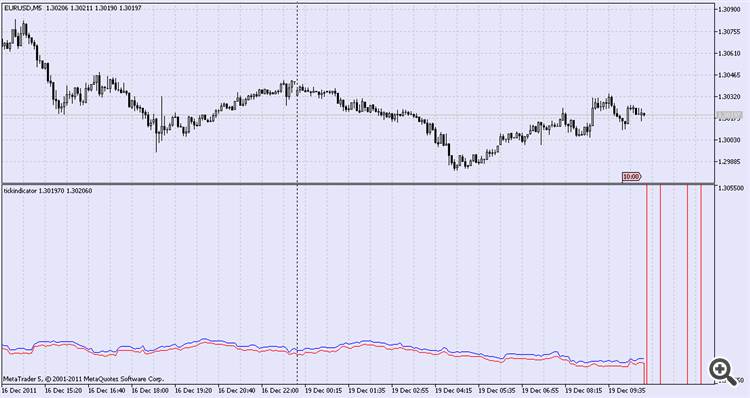
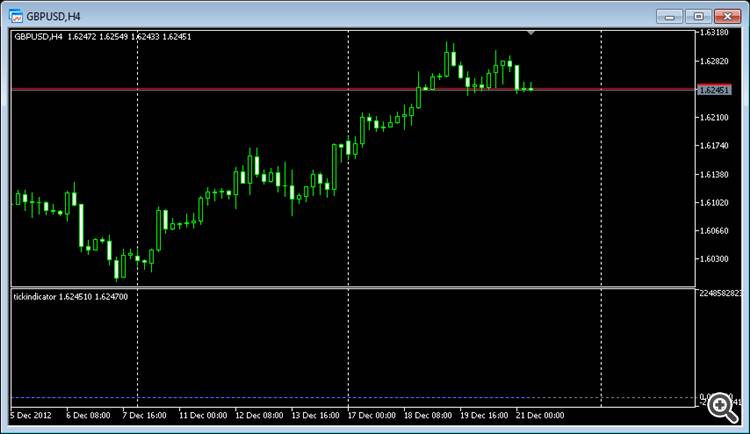
I have this problem when running tickindicator.mq5.
I compiled the indicator. I run it.
The indicator window appears. There is a scale with large numbers of both minimum and maximum. And the indicator moves along the horizontal line. I tried fixing the minimum and maximum of the indicator. The indicator seems to appear, but there are some vertical lines on the bid.
It is necessary to initialise all values in the indicator buffer.
Most likely IMHO - I haven't looked at the code)
Tell me where to fix something.
On timeframes greater than M30 the scale starts to show wild numbers.
As my colleague Dima_S suggested, when initialising the indicator, it is worth filling the buffers with something.
And since we have TickIndicator.mq5 code:
//+------------------------------------------------------------------+
//| OnInit() function|
//+------------------------------------------------------------------+
void OnInit()
  {
// array BidBuffer[] is an indicator buffer
   SetIndexBuffer(0,BidBuffer,INDICATOR_DATA);
// AskBuffer[] array is an indicator buffer
   SetIndexBuffer(1,AskBuffer,INDICATOR_DATA);
// zero values of the Bid line are not drawn
   PlotIndexSetDouble(0,PLOT_EMPTY_VALUE,0);
// zero values of the Ask line are not drawn
   PlotIndexSetDouble(1,PLOT_EMPTY_VALUE,0);
  }
It is necessary to insert the following lines:
ArrayInitialize(BidBuffer,0);
ArrayInitialize(AskBuffer,0);
As my colleague Dima_S suggested, when initialising the indicator it is worth filling the buffers with something. I did so:
ArrayInitialize(BidBuffer,EMPTY_VALUE);
ArrayInitialize(AskBuffer,EMPTY_VALUE);
I did that, but it didn't help.
ArrayInitialize(BidBuffer,0.0);
ArrayInitialize(AskBuffer,0.0);
This way too.
- Free trading apps
- Over 8,000 signals for copying
- Economic news for exploring financial markets
You agree to website policy and terms of use


New article Creating Tick Indicators in MQL5 is published:
In this article, we will consider the creation of two indicators: the tick indicator, which plots the tick chart of the price and tick candle indicator, which plot candles with the specified number of ticks. Each of the indicators writes the incoming prices into a file, and uses the saved data after the restart of the indicator (these data also can be used by the other programs)
Author: Denis