Indicators: Spread Of Symbols
In order not to create such special cases in Codebase, decorate the base once - ChartBuilder.
That's the thing, for the simplest things you don't need to learn anything there. In your case, everything is extremely elementary:
Formula1 = "AUDUSD - NZDUSD"; Just rewrite a well-thought-out toolkit from MQL4 to MQL5. And you will be able to implement almost 99% of the invented indicators on the topic of pair trading at a good level.
For educational purposes such an indicator is simply necessary.
You can see at a glance what to add where. When you improve (expand the functionality) you understand better what is going on.
I'm trying to put a channel on it, but it's not working properly.
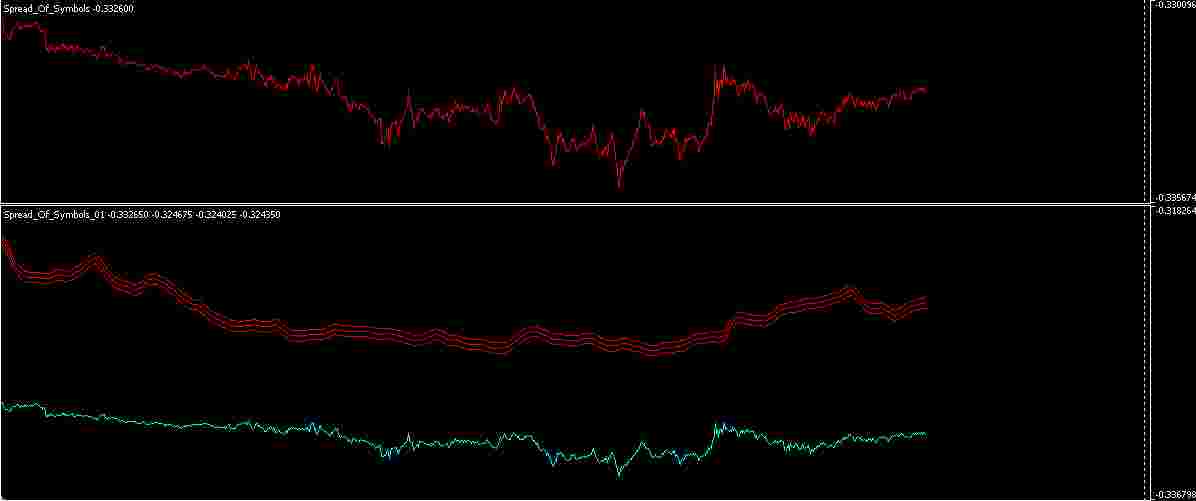
//+------------------------------------------------------------------+
//|ProjectName |
//|Copyright 2012, CompanyName |
//| http://www.companyname.net |
//+------------------------------------------------------------------+
#property indicator_separate_window
#property indicator_buffers 4
#property indicator_plots   4
//--- plot Label1
#property indicator_label1  "Label1"
#property indicator_type1   DRAW_LINE
#property indicator_color1  clrAqua
#property indicator_style1  STYLE_SOLID
#property indicator_width1  1
//--- plot Label2
#property indicator_label2  "Label2"
#property indicator_type2   DRAW_LINE
#property indicator_color2  clrRed
#property indicator_style2  STYLE_SOLID
#property indicator_width2  1
//--- plot Label3
#property indicator_label3  "Label3"
#property indicator_type3   DRAW_LINE
#property indicator_color3  clrRed
#property indicator_style3  STYLE_SOLID
#property indicator_width3  1
//--- plot Label4
#property indicator_label4  "Label4"
#property indicator_type4   DRAW_LINE
#property indicator_color4  clrRed
#property indicator_style4  STYLE_SOLID
#property indicator_width4  1

//--- input parameters
input string         symbol1="EURUSD";
input string         symbol2="GBPUSD";
input double         mass_of_symbol1=1;
input double         mass_of_symbol2=1;
input int            ENPeriod    =  14;
input ENUM_MA_METHOD ENMethod    =  MODE_SMA;
input double         ENDeviation =  0.1;

//--- indicator buffers
double         UBuffer[];
double         LBuffer[];
double         CBuffer[];

#include <IncOnArray/IncEnvelopesOnArray.mqh>
CEnvelopesOnArray en;

int i,r1,r2,j;
double S,prs,k1,k2,d1,d2;
//--- indicator buffers
double        ind1[];
//+------------------------------------------------------------------+
//| Custom indicator initialisation function |
//+------------------------------------------------------------------+
int OnInit()
  {
    en.Init(ENPeriod,ENMethod,ENDeviation);

    //--- indicator buffers mapping
    SetIndexBuffer(0,ind1,INDICATOR_DATA);
    SetIndexBuffer(1,UBuffer,INDICATOR_DATA);
    SetIndexBuffer(2,LBuffer,INDICATOR_DATA);
    SetIndexBuffer(3,CBuffer,INDICATOR_DATA);

    PlotIndexSetInteger(1,PLOT_DRAW_BEGIN,en.BarsRequired());
    PlotIndexSetString(1,PLOT_LABEL,en.Name()+" Upper");

    PlotIndexSetInteger(2,PLOT_DRAW_BEGIN,en.BarsRequired());
    PlotIndexSetString(2,PLOT_LABEL,en.Name()+" Lower");

    PlotIndexSetInteger(3,PLOT_DRAW_BEGIN,en.BarsRequired());
    PlotIndexSetString(3,PLOT_LABEL,en.Name()+" MA");

    //---
   return(0);
  }
//+------------------------------------------------------------------+
//| Custom indicator iteration function |
//+------------------------------------------------------------------+
int OnCalculate(const int rates_total,
                const int prev_calculated,
                const datetime &time[],
                const double &open[],
                const double &high[],
                const double &low[],
                const double &close[],
                const long &tick_volume[],
                const long &volume[],
                const int &spread[])
  {
//---
   ArraySetAsSeries(time,true);ArraySetAsSeries(open,true);ArraySetAsSeries(high,true);ArraySetAsSeries(low,true);
   ArraySetAsSeries(close,true);ArraySetAsSeries(tick_volume,true);ArraySetAsSeries(volume,true);ArraySetAsSeries(spread,true);

   ArraySetAsSeries(ind1,true);
   MqlRates rates1[]; ArraySetAsSeries(rates1,true);
   MqlRates rates2[]; ArraySetAsSeries(rates2,true);

   if(prev_calculated<rates_total)
     {
      for(i=0;i<rates_total;i++)
        {
         CopyRates(symbol1,0,time[i],1,rates1);
         CopyRates(symbol2,0,time[i],1,rates2);
         ind1[i]=mass_of_symbol1*rates1[0].close-mass_of_symbol2*rates2[0].close;
        }
     }

   en.Solve(rates_total,prev_calculated,ind1,CBuffer,UBuffer,LBuffer);

//--- return value of prev_calculated for next call
   return(rates_total);
  }
//+------------------------------------------------------------------+
Looks like I need to understand the Integer codes.
//ArraySetAsSeries(ind1,true);
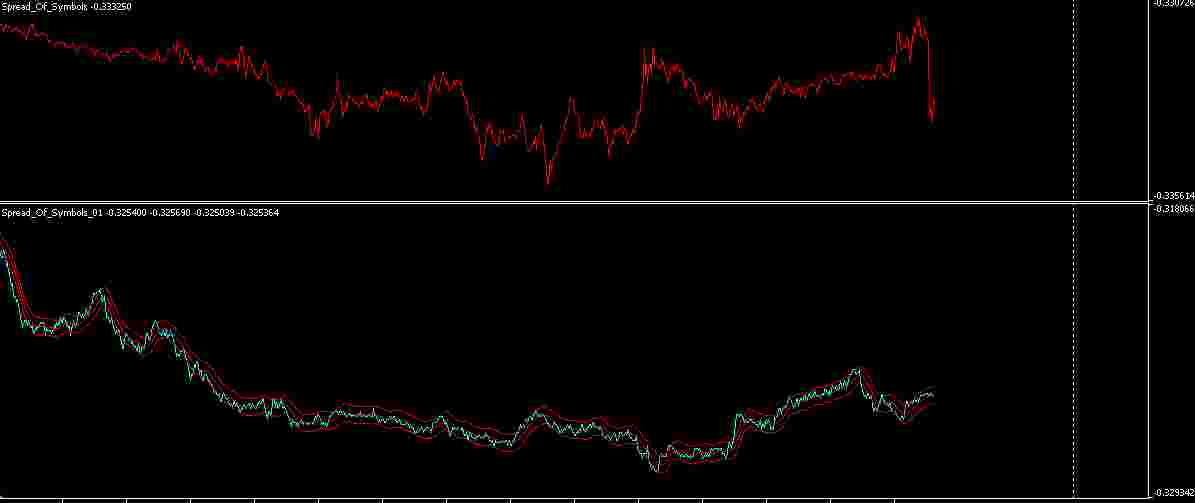
I removed indexing and it started to display, but not correctly.
Forum on trading, automated trading systems and testing trading strategies
newdigital, 2014.01.12 08:59
What Does a Spread Tell Traders?
- Spreads are based off the Buy and Sell price of a currency pair.
- Costs are based off of spreads and lot size.
- Spreads are variable and should be referenced from your trading software.
Spreads and Forex
Every market has a spread and so does Forex. A spread is simply defined as the price difference between where a trader may purchase or sell an underlying asset. Traders that are familiar with equities will synonymously call this the Bid: Ask spread.
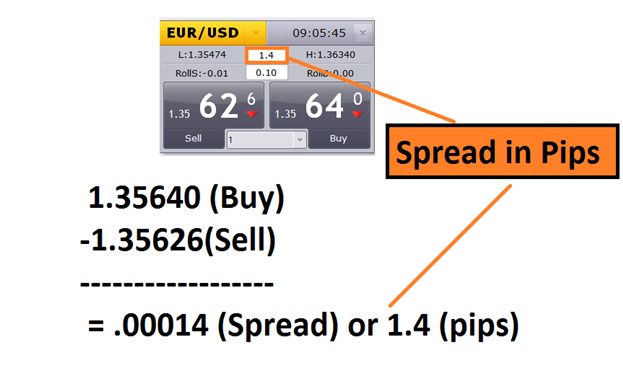
Below we can see an example of the spread being calculated for the EURUSD. First we will find the buy price at 1.35640 and then subtract the sell price of 1.32626. What we are left with after this process is a reading of .00014. Traders should remember that the pip value is then identified on the EURUSD as the 4th digit after the decimal, making the final spread calculated as 1.4 pips.
Now we know how to calculate the spread in pips, let’s look at the actual cost incurred by traders.
Spreads Costs and Calculations
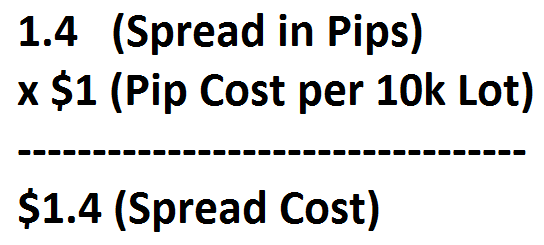
Since the spread is just a number, we now need to know how to relate the spread into Dollars and Cents. The good news is if you can find the spread, finding this figure is very mathematically straight forward once you have identified pip cost and the number of lots you are trading.
Using the quotes above, we know we can currently buy the EURUSD at 1.3564 and close the transaction at a sell price of 1.35474.That means as soon as our trade is open, a trader would incur 1.4 pips of spread. To find the total cost, we will now need to multiply this value by pip cost while considering the total amount of lots traded. When trading a 10k EURUSD lot with a $1 pip cost, you would incur a total cost of $1.40 on this transaction.
Remember, pip cost is exponential. This means you will need to multiply this value based off of the number of lots you are trading. As the size of your positions increase, so will the cost incurred from the spread.
Changes in the Spread
It is important to remember that spreads are variable meaning they will not always remain the same and will change sporadically. These changes are based off of liquidity, which may differ based off of market conditions and upcoming economic data. To reference current spread rates, always reference your trading platform.Forum on trading, automated trading systems and testing trading strategies
newdigital, 2014.01.30 09:25
Forex Spreads and the News (based on dailyfx article)
- Spreads are based off the Buy and Sell price of a currency pair.
- Spreads are variable and can change during news.
- Watch for normalization of spreads, shortly after economic events.
Financial markets have the ability to be drastically effected by economic news releases. News events occur throughout the trading week, as denoted by the economic calendar, and may increase market volatility as well as increase the spreads you see on your favorite currency pairs.
It is imperative that new traders become familiar with what can happen during these events. So to better prepare you for upcoming news, we are going to review what happens to Forex spreads during volatile markets.
Spreads and the News
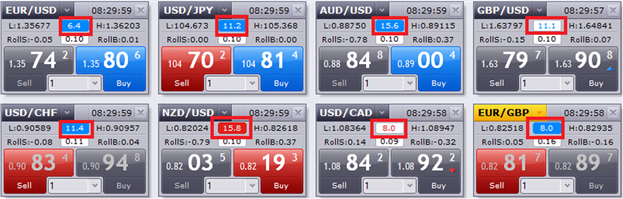
News is a notorious time of market uncertainty. These releases on the economic calendar happen sporadically and depending if expectations are met or not, can cause prices to fluctuate rapidly. Just like retail traders, large liquidity providers do not know the outcome of news events prior to their release! Because of this, they look to offset some of their risk by widening spreads.
Above is an example of spreads during the January NFP employment number release. Notice how spreads on the Major Forex pairs widened. Even though this was a temporary event, until the market normalizes traders will have to endure wider costs of trading.
Dealing with the Spread
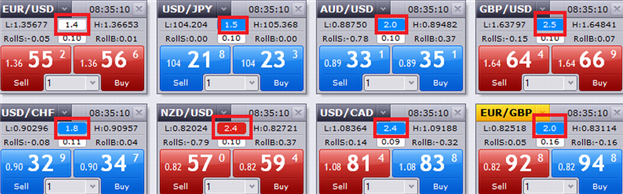
It is important to remember that spreads are variable, meaning they will not always remain the same and will change as liquidity providers change their pricing. Above we can see how quickly spreads normalize after the news. In 5 minutes, the spreads on the EURUSD moved from 6.4 pips back to 1.4 pips. So where does that leave traders wanting to execute orders around the news?
Traders should always consider the risk of trading volatile markets. One of the options for trading news events is to immediately execute orders at market in hopes that the market volatility covers the increased spread cost. Or, traders can wait for markets to normalize and then take advantage of added liquidity once market activity subsides.
instead of using the difference, may we use the ratio ? (symbol1/symbol2)
Thanks !
- Free trading apps
- Over 8,000 signals for copying
- Economic news for exploring financial markets
You agree to website policy and terms of use
Spread Of Symbols:
The indicator shows the chart of the difference (sum) of trading symbols' prices. It is suitable for visual estimation of trading symbols' correlation. It will be very useful for traders interested in pairs trading (spread trading). Indicator bars are synchronized by time with the bars of the chart the indicator is launched at.
Author: Dmitry