EURUSD Technical Analysis 2015, November: after NFP - bearish breakdown with new Fibo key targets
Forum on trading, automated trading systems and testing trading strategies
Sergey Golubev, 2015.11.09 08:45
USD, EUR, GBP, CAD, AUD: Outlooks For The Week - Morgan Stanley (based on efxnews article)
EUR: Bearish
"We have revised our EUR forecasts lower and now look for 1.06 at year
end. Our economists now expect another 10 bp cut in the deposit rate,
an addition to QE, and an extension of the asset purchase programme. All
of this should be EUR negative. We believe the deposit rate cut is
likely to be the most currency negative, as it should incentivize
foreign investors to fund in EUR and domestic investors to seek returns
overseas."
USD: Bullish
"We believe USD could start to see inflows related to investment,
rather than repatriation of assets. While the latter does not require
tighter Fed policy, the former will benefit from a higher probability of
Fed hikes. Indeed, this is likely to support US assets and boost USD."

GBP: Bearish
"Markets have taken the BoE dovishly as they revised CPI forecasts and
started to get concerned about the impact of EM growth on the UK
economy. On top of this, there is a downside risk to near-term inflation
as the strong trade-weighted GBP (ERI) puts downward pressure on import
prices. The focus is now on EM data again and its impact on commodity
prices and general market volatility as GBP remains sensitive to all of
these factors."
Forum on trading, automated trading systems and testing trading strategies
Sergey Golubev, 2015.11.09 18:29
The Royal Bank of Scotland made a forecast for EUR/USD telling that "The cleanest way to play is still short EUR/USD." (based on article). So, let's made very short review of intra-day situation for this pair.
The price (H4 timeframe) is on bearish market condition located below 100 period SMA and 200 period SMA on the bearish area of the chart. Price is ranging within the following key support/resistance levels:
- 1.0704 key support level, and
- 1.0884 key resistance level.
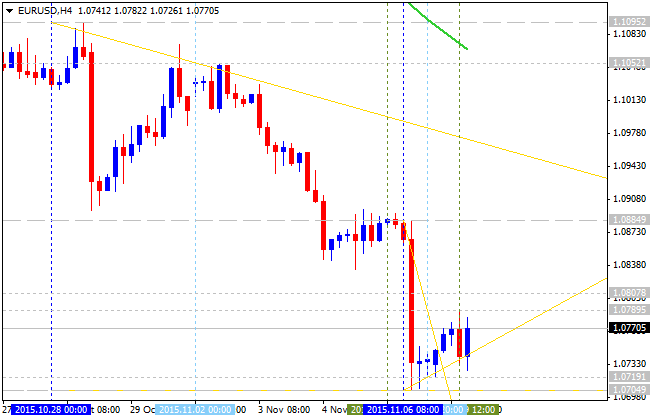
- If the price will break 1.0704 support from above to below on close bar so the bearish trend will be continuing.
- if the price will break 1.0884 resistance level from below to above so we may see the bear market rally to be started.
- If not so the price will be moved within the levels.
Thus, The Royal Bank of Scotland is correct one concerning the trend: this is bearish anyway in intra-day basis for the pair.
Forum on trading, automated trading systems and testing trading strategies
Sergey Golubev, 2015.11.10 11:08
Technical Overview: Will EUR/USD Break 1.0461 Support? (adapted from article)
BNP Paribas updated their forecast related to the EUR/USD price movement in long-term situation - they told the following: "we are somewhat sceptical on the EURUSD’s ability to test and break the previous 2015 low of around 1.0460." Well ... let's evaluate this forecasting situation with technical point of view.
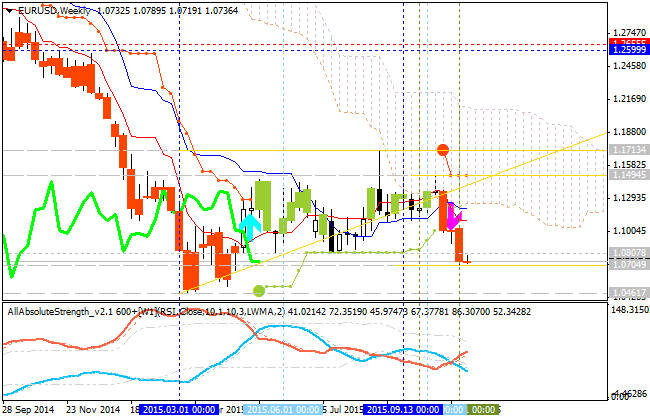
Ichimoku analysis.
Weekly
price is on bearish market condition for the crossing key support level
at 1.0704 from above to below for the bearish trend to be continuing.
This is bearish breakdown which is going on for right now: Chinkou Span
line crossed the price to below for the bearish breakdown to be
continuing. And the nearest bearish target is 1.0461. So, there are 2
scenarios concerning the price movement in long-term situation:
- the price is ranging within 1.0461 support and 1.1713 resistance levels, or
- the price is breaking 1.0461 support level from above to below on the close bar for example.
Pivot
Points.
The price is breaking S2 YR1 Pivot at 1.0672 from above to
below with 1.0461 as the next target. And there are two similar
scenarios for the price movement related to Pivot Points:
- the price is ranging within 1.0461 support and S1 Pivot at 1.1337, or
- the price is breaking S2 Pivot at 1.0672 from above to below on the close bar.
The Strategy: watch the price to break 1.0672with possible sell trade with 1.0461 as a target.
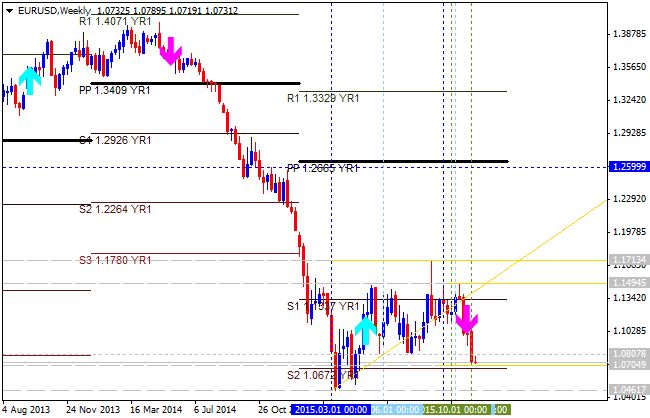
| Instrument | S2 Pivot | S1 Pivot | Yearly PP | R1 Pivot |
|---|---|---|---|---|
| EUR/USD |
1.0672 | 1.1337 |
1.2665 |
1.3329 |
Forum on trading, automated trading systems and testing trading strategies
Sergey Golubev, 2015.11.11 13:26
Intraday Outlooks For EUR/USD - SEB (adapted from efxnews article)
Skandinaviska Enskilda Banken made a technical forecast for telling that EUR/USD will go as high as 1.08 before 1.0655 support level will be broken by the price from above to below. As we see from the chart below - the price is on bearish market condition for the ranging between the following key support/resistance levels:
- Fibo support level at 1.0674 located far below 100 day SMA (100 SMA) and 200 day SMA (200 SMA) in the primary bearish area of the chart, and
- 50.0% Fibo resistance level at 1.1082 located near 100 SMA/200 SMA on the border between the primary bearish and the primary bullish on the chart.

Descending triangle pattern was formed by the price with 1.0707 support level to be broken for the bearish trend to be continuing up to 1.0674 as the nearest bearish target.
The Strategy: watch W1 price to break 1.0707 support level for possible sell trade with 1.0674 as the target.

Forum on trading, automated trading systems and testing trading strategies
Sergey Golubev, 2015.11.13 07:46
EURUSD Long-Term Outlook - bearish ranging near S2 Pivot level (adapted from the article)
Credit Suisse made a forecast for EUR/USD for 2016 estimated 1.00 as
the first target and 0.85 as the second one. Let's evaluate this
forecast with the technical point of view.
EUR/USD: bearish ranging near S2 Pivot level.
This pair is on bearish market condition for the ranging within S1
Pivot at 1.1337 and S2 Pivot at 1.0672: the price is on bearish
breakdown for now with 1.0672 level crossing from above to below for
0.9599 as the next bearish target.
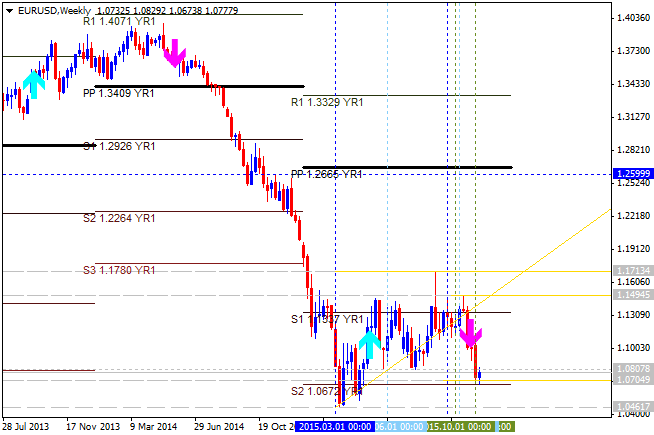
- if the price breaks S2 Pivot at 1.0672 from above to below so the bearish trend will be continuing up to 0.9599 as the next bearish target;
- if the price breaks 0.9599 support level from above to below so we may see the bearish breakdown with S3 Pivot at 0.9344 as the target;
- if the price
breaks S1 Pivot at 1.1337 from below to above so we may see the local uptrend as the secondary market rally within the primary bearish market condition;
- if not so the price will be moved within the channel.
| Instrument | S3 Pivot | S2 Pivot | S1 Pivot | Yearly PP | R1 Pivot |
|---|---|---|---|---|---|
| EUR/USD |
0.9344 | 1.0672 | 1.1337 | 1.2665 | 1.3329 |
Forum on trading, automated trading systems and testing trading strategies
Sergey Golubev, 2015.11.13 17:33
Forex Weekly Outlook November 16-20 (based on the article)
The US dollar had a mixed week after the NFP. Japan GDP data, Inflation data from the UK, the US and Canada and a rate decision in Japan stand out. These are the main events on forex calendar. Here is an outlook on the market-movers for this week.
A long list of Fed speakers basically left expectations for a Fed hike unchanged, thus leaning towards a move in December. Yellen remained silent. In the euro-zone. Data was mixed, with a disappointment in retail sales but upbeat consumer confidence also a positive JOLTs report, Draghi reiterated his desire to act in December: provide more easing. In Australia, the jobs report was excellent and falling oil prices weighed on the Canadian dollar.
- Japan GDP data: Sunday 23:50. Japan’s economy contracted 0.4% in the second quarter, when Gross domestic product declined by an annualized 1.6% between April to June. The contraction was less than expected, but consumer spending and investments weakened. Many economists believe inflation will not reach the 2% target by summer 2016 expecting further monetary easing in the coming months. GDP is expected to remain negative at -0.1%.
- Mario Draghi speaks: Monday. 10:15 and Friday, 8:00. ECB President Mario Draghi will give speeches in Madrid and in Frankfurt. During his talk before the European Parliament last week, Draghi dropped another hint that the ECB is preparing further monetary easing measures to boost the Eurozone’s recovery. The ECB president admitted that the 2% inflation target will take longer to achieve and that the central bank will re-examine a QE program in early December. Market volatility is expected.
- UK inflation data: Tuesday, 9:30. UK Consumer Prices fell to -0.1% in September hovering close to zero for most of this year. Food prices declined by 2.5% in the year amid ongoing supermarket price wars. According to the low CPI release, the Bank is in no hurry to raise rates anytime soon. Furthermore, core CPI also remained weak at 1.0% suggesting no underlying inflationary pressures despite continuing strength in wage growth. Consumer prices are expected to remain at -0.1%.
- German ZEW Economic Sentiment: Tuesday, 10:00 German analysts and investors sentimentplunged in October to 1.9 points, following 12.1 in September amid the scandal at Volkswagen and the weakness in emerging markets. Analysts expected a reading of 6.8. Current conditions declined to 55.2 points from 67.5 points in September, below expectations for a drop to 64.7. German economic sentiment is expected to reach 6.7% this time.
- US inflation data: Tuesday, 13:30. Consumer prices in the U.S. declined 0.2% in September while Core CPI excluding the volatile food and energy sectors gained 0.2%. Analysts expected CPI to drop 0.2% and Core CPI was predicted to rise by 0.1%. Despite the fall in headline inflation, core prices edged up 1.9% in the past 12-months, from 1.8% the prior month getting closer to a December rate hike call. The energy index plunged 4.7% in September. A continued decline in the gasoline index, this time by 9%, was the main cause in the decline for overall CPI. Both CPI and Core CPI are forecasted to rise 0.2% in October.
- US Building Permits: Wednesday, 13:30. Building permits declined 5% to a 1.1 million pace in September the lowest number since March. Meanwhile, applications for single-family projects declined 0.3% to a 697,000 unit pace; indicating this component will come to a standstill in the coming months. However, housing starts were encouraging consistent with the builders increasing confidence in the outlook for their industry. The number of permits is expected to reach a unit pace of 1.15 million in October
- US FOMC Meeting Minutes: Wednesday, 19:00. In the Fed’s October decision, the tone was relatively hawkish regarding inflation and employment, not expressing real worries. In addition, they provided a hint about action in December. The minutes may reveal how hawkish the members really are and how close a December hike is real. Note that the excellent NFP was released in the meantime, and that the Fed edits the minutes until the last minute before the publication. Markets always move by any wording nuances.
- Japan rate decision: Thursday. The Bank of Japan maintained its monetary policy, refraining from adding further stimulus at its policy meeting in October. However, the members reiterated their promise to increase the monetary base at an annual rate of 80 trillion yen ($660 billion). At the Press conference, following the meeting, BOJ Governor Haruhiko Kuroda said there were no proposals to ease monetary policy during the meeting, and blamed the low energy prices for the failure to achieve the BOJ’s inflation target.
- US Unemployment Claims: Thursday, 13:30. New U.S. applications for unemployment benefits remained unchanged last week, indicating strong labor market conditions. The data was worse than the 270,000 forecasted but still supports the Federal Reserve call to raise interest rates next month. The four-week moving average of claims rose 5,000 to 267,750 last week, still close to a 42-year low. The number of people continuing to receive benefits after an initial week of aid increased 5,000 to 2.17 million last week. Jobless claims for this week are expected to reach 272,000.
- US Philly Fed Manufacturing Index: Thursday, 15:00. The Philadelphia manufacturing index remained in negative territory for the second month in a row reaching -4.5 in October after posting -6 in the prior month. The negative figures show sharp slowing in the manufacturing sector. The strength of the US dollar has been weighing on US industry since last fall, making products less competitive in the global market. Philadelphia manufacturing index is expected to rise to 0.1 in November.
how do u calciulate yearly support and resistances ?
classical PSR or something else ?
You can use this one in the beginning:
Forum on trading, automated trading systems and testing trading strategies
How to Start with Metatrader 5
Sergey Golubev, 2015.02.03 18:48
Market condition setup (indicators and template) is hereForum on trading, automated trading systems and testing trading strategies
Sergey Golubev, 2015.11.16 09:55
EUR/USD: book profit near 1.0600 psy level (adapted from the article)
United Overseas Bank is suggesting to book profit near 1.0600 psy level for short trades. The price is located below 100 SMA/200 SMA for the primary bearish market condition with the secondary ranging within 1.0461 support and 1.1494 resistance level for the breaking 1.0673 support from above to below for the bearish trend to be continuing. Psy level at 1.0600 is located far below 100 SMA/200 SMA in the bearish area of the chart between 1.0461 support and 1.0673 support levels but UOB is telling that this level will not be easy to be broken by the price, and it is very unlikely to be broken for this week for example.
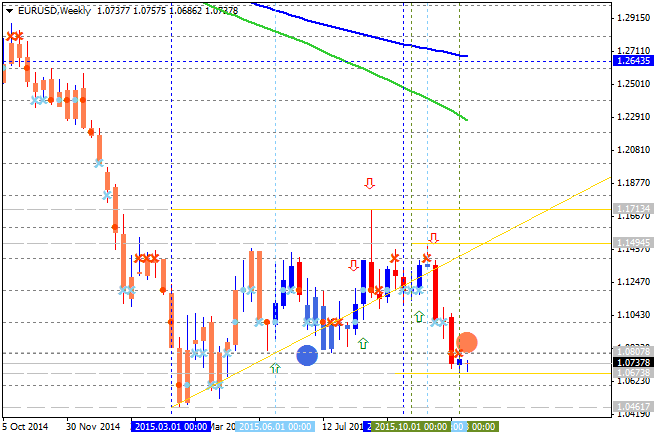
If price will break 1.1494
resistance level so the local uptrend as the secondary market rally
will be started within the primary bearish market condition.
If the price will break 1.0673 support so the bearish trend will be continuing up to 1.0600 psy level.
If not so the price will be ranging between the levels.
- Recommendation for long: watch close price to break 1.1494 for possible buy trade
- Recommendation
to go short: watch close price to break 1.0673 support level for possible sell trade with 1.0600 as the target
- Trading Summary: ranging bearish
- Free trading apps
- Over 8,000 signals for copying
- Economic news for exploring financial markets
You agree to website policy and terms of use
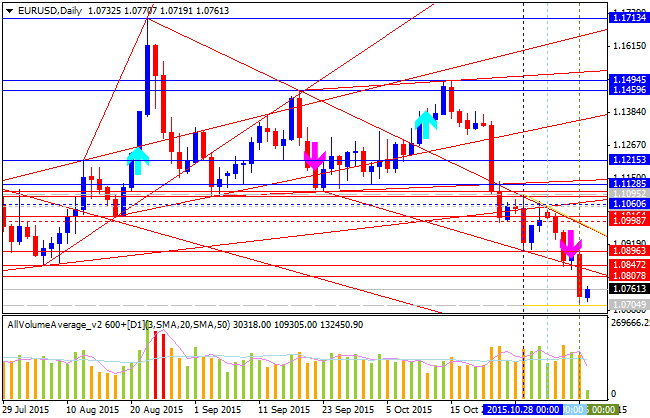
The price is on bearish breakdown for crossing 1.0807 support level from above to below for the breakdown to be continuing with 1.0461 as the next bearish target.
W1 price is on primary bearish market:
MN price is on bearish breakdown too for 1.0461 as the real bearish target.
If W1 price will break 1.0461 support level so the primary bearish will be continuing.
If W1 price will break 1.1494 resistance level so the reversal to the primary bullish condition will be started with the secondary ranging (the price will be inside Ichimoku cloud/kumo in this case).
If W1 price will break 1.2332 resistance level so the price will be fully reversed to the bullish market condition with good breakout possibility.
If not so the price will be ranging within the levels.
TREND : breakdown of support levels