EURUSD Technical Analysis 2015, 15.11 - 22.11: daily ranging bearish, weekly bearish breakdown
Forum on trading, automated trading systems and testing trading strategies
Sergey Golubev, 2015.11.16 09:55
EUR/USD: book profit near 1.0600 psy level (adapted from the article)
United Overseas Bank is suggesting to book profit near 1.0600 psy level for short trades. The price is located below 100 SMA/200 SMA for the primary bearish market condition with the secondary ranging within 1.0461 support and 1.1494 resistance level for the breaking 1.0673 support from above to below for the bearish trend to be continuing. Psy level at 1.0600 is located far below 100 SMA/200 SMA in the bearish area of the chart between 1.0461 support and 1.0673 support levels but UOB is telling that this level will not be easy to be broken by the price, and it is very unlikely to be broken for this week for example.
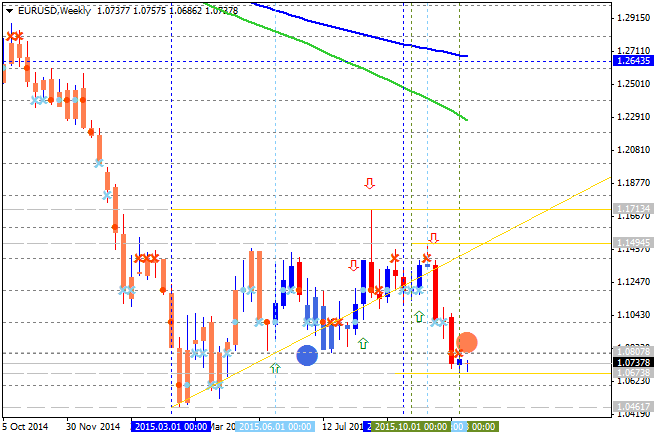
If price will break 1.1494
resistance level so the local uptrend as the secondary market rally
will be started within the primary bearish market condition.
If the price will break 1.0673 support so the bearish trend will be continuing up to 1.0600 psy level.
If not so the price will be ranging between the levels.
- Recommendation for long: watch close price to break 1.1494 for possible buy trade
- Recommendation
to go short: watch close price to break 1.0673 support level for possible sell trade with 1.0600 as the target
- Trading Summary: ranging bearish
Forum on trading, automated trading systems and testing trading strategies
Sergey Golubev, 2015.11.17 18:04
Technical Outlooks For EUR/USD by SEB (adapted from the article)
Skandinaviska Enskilda Banken estimated the real bearish target for this pair as 1.0481 in the near future with stated that the price will be moved to 1.05/1.04 area soon. Let's evaluate the situation with the technical points of view.
As we see from the chart below - weekly price is on bearish market condition located below 100 period SMA (100 SMA) and 200 period SMA (200 SMA) with the ranging within the following key support/resistance levels:
- Fibo resistance level at 1.1713 located below 100 SMA/200 SMA and near the border between the primary bearish and the primary bullish trend on the chart, and
- key support level at 1.0461 located far below 100 SMA/200 SMA in the primary bearish area of the chart.
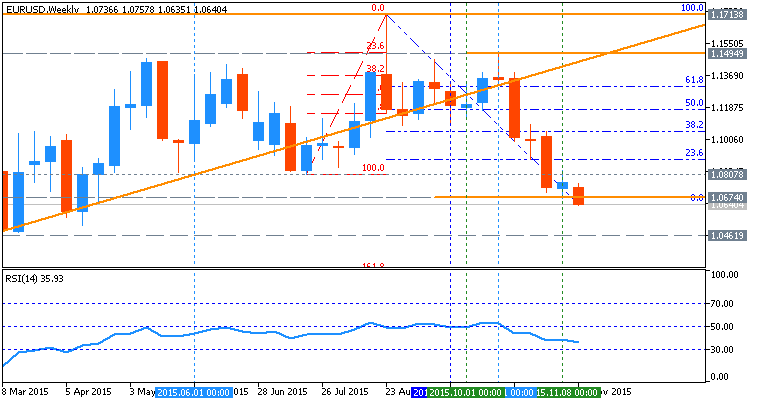

The price is breaking Fibo support level at 1.0634 from above to below on open weekly bar for now for the bearish trend to be continuing with 1.0461 as the next real bearish target. RSI indicator is estimating the bearish trend with non-oversold way.
The Strategy. Watch close price to break Fibo support level at 1.0634 for possible sell trade with the target to be near and above 1.0461 support level.Forum on trading, automated trading systems and testing trading strategies
Sergey Golubev, 2015.11.18 08:08
Goldman Sachs: EUR/USD Targets into Fed December meetings (based on the article)
Goldman Sachs made a forecast for EUR/USD related to Fed December meetings: "Given that the beginning of 2016 is likely to bring renewed vigour to risk-taking, we think it is perfectly possible for EUR/$ to reach 0.95 – our 12-month forecast – by end-March." Let's evaluate the situation related to this pair in long term trend forecasting for example.
- Weekly
price is breaking S2 Pivot at 1.0672 for 1.0461 as the next bearish
target. If this second S2 support level will be broken so the price will
be ranging between S2 Pivot at 1.0672 and S3 Pivot at 0.9344.
- There are bearish breakdown level for the price on the way to S3 Pivot - this is 0.9524 key support level, and if this 0.9524 is broken so we may see good bearish breakdown up to S3 Pivot at 0.9344 as the next real bearish target in this case.
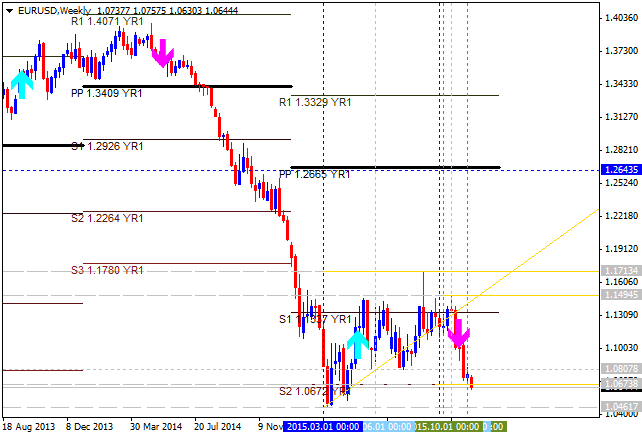
- if the price breaks 1.0461 support level so the primary bearish will be continuing up to 0.9524 as the next bearish target;
- if not so the price will be moved within pivot support levels.
| Instrument | S3 Pivot | S2 Pivot | S1 Pivot | Yearly PP | R1 Pivot |
|---|---|---|---|---|---|
| EUR/USD | 0.9344 | 1.0672 | 1.1337 | 1.2665 |
1.3329 |
Forum on trading, automated trading systems and testing trading strategies
Sergey Golubev, 2015.11.19 07:19
EUR/USD is likely to close on intermediate low (based on the article)
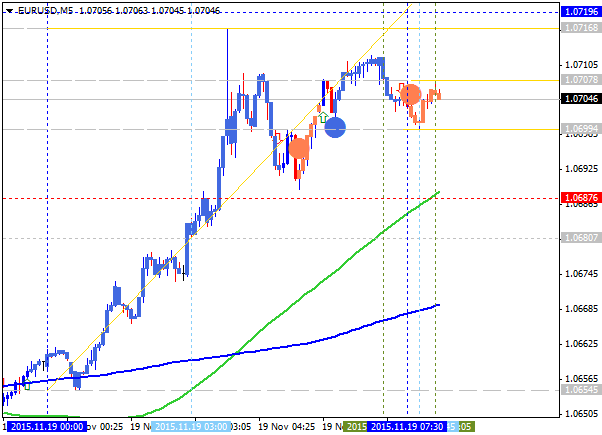
United Overseas Bank made a forecast for EUR/USD telling that the price will be closed on intermediate low: "The quick rebound from the overnight low of 1.0615 suggests that EUR/USD is likely close to making an interim low." Let's evaluate intra-day situation from the technical point of voew.
M5 price is located to be above SMA with period 100 (100-SMA) and SMA with the period 200 (200-SMA) for the primary bullish market condition with the ranging within the following key reversal s/r levels:
- 1.0719 resistance level located far above 100-SMA/200-SMA in the bullish area of the chart, and
- 1.0687 support level located on the border between the primary bearish and the primary bullish trend.
There are 3 scenarios for the price movement for now:
- If the price will break 1.0719 resistance level so the bullish trend will be continuing.
- if price will break 1.0687 support so the reversal of the price movement from the primary bullish to the primary bearish market condition will be started with the secondary ranging - the price will be located between 100-SMA and 200-SMA in this case.
- if not so the price will be ranging within the levels.
| Resistance | Support |
|---|---|
| 1.0716 | 1.0687 |
| 1.0719 | 1.0654 |
- Recommendation to go short: watch the price to break 1.1029 support level for possible sell trade
- Recommendation to go long: watch the price to break 1.0687 resistance level for possible sell trade
- Trading Summary: ranging
SUMMARY : bullish
- Free trading apps
- Over 8,000 signals for copying
- Economic news for exploring financial markets
You agree to website policy and terms of use
Daily price is on the primary bearish market condition for the secondary ranging to be located below Ichimoku cloud and 'reversal' Sinkou Span lines within the following key support/resistance levels:
- 1.1029 key resistance level located near the border between the primary bearish and the primary bullish trend on the chart;
- 1.0672 key support level located far below Ichimoku cloud in the primary bearish area of the chart.
Bullish reversal resistance level for the pair is 1.1494 located above Ichimoku cloud in the primary bullish area.D1 price - ranging bearish:
If D1 price will break 1.0672 support level on close D1 bar so the bearish trend will be continuing with possible breakdown up to 1.0461 as the next bearish target.
If D1 price will break 1.1029 resistance level on close D1 bar so we may see the local uptrend as the bear market rally with the good possibility to the reversal of the price movement to the bullish market condition.
If D1 price will break 1.1494 resistance level on close D1 bar so the price will be fully reversed to the bullish condition located to be above Ichimoku cloud in the bullish area of the chart.
If not so the price will be on ranging within the levels.
SUMMARY : bearish
TREND : ranging bearish