#property indicator_buffers
#property indicator_plots
Read about it:
hi,
thank you for reply to me.
what`s the mean?
How can i do?
Hi,karputov.
thank you for reply to me.
I don`t know anything how make indicator.
sorry.
can`t you modify the file attached ?
have a nice day.
That should make your indicator? What timeframe it should work?
Hi,Karputov.
Thank you for reply to me.
I don`y use any indicators.
I use this extend box only on mt4.
so i want to use this box on mt5.
because many timeframes are available on mt5.
i want to use this box on all timeframes.
and extend period is 3MN.
thank you for reply to me.
have a nice day.
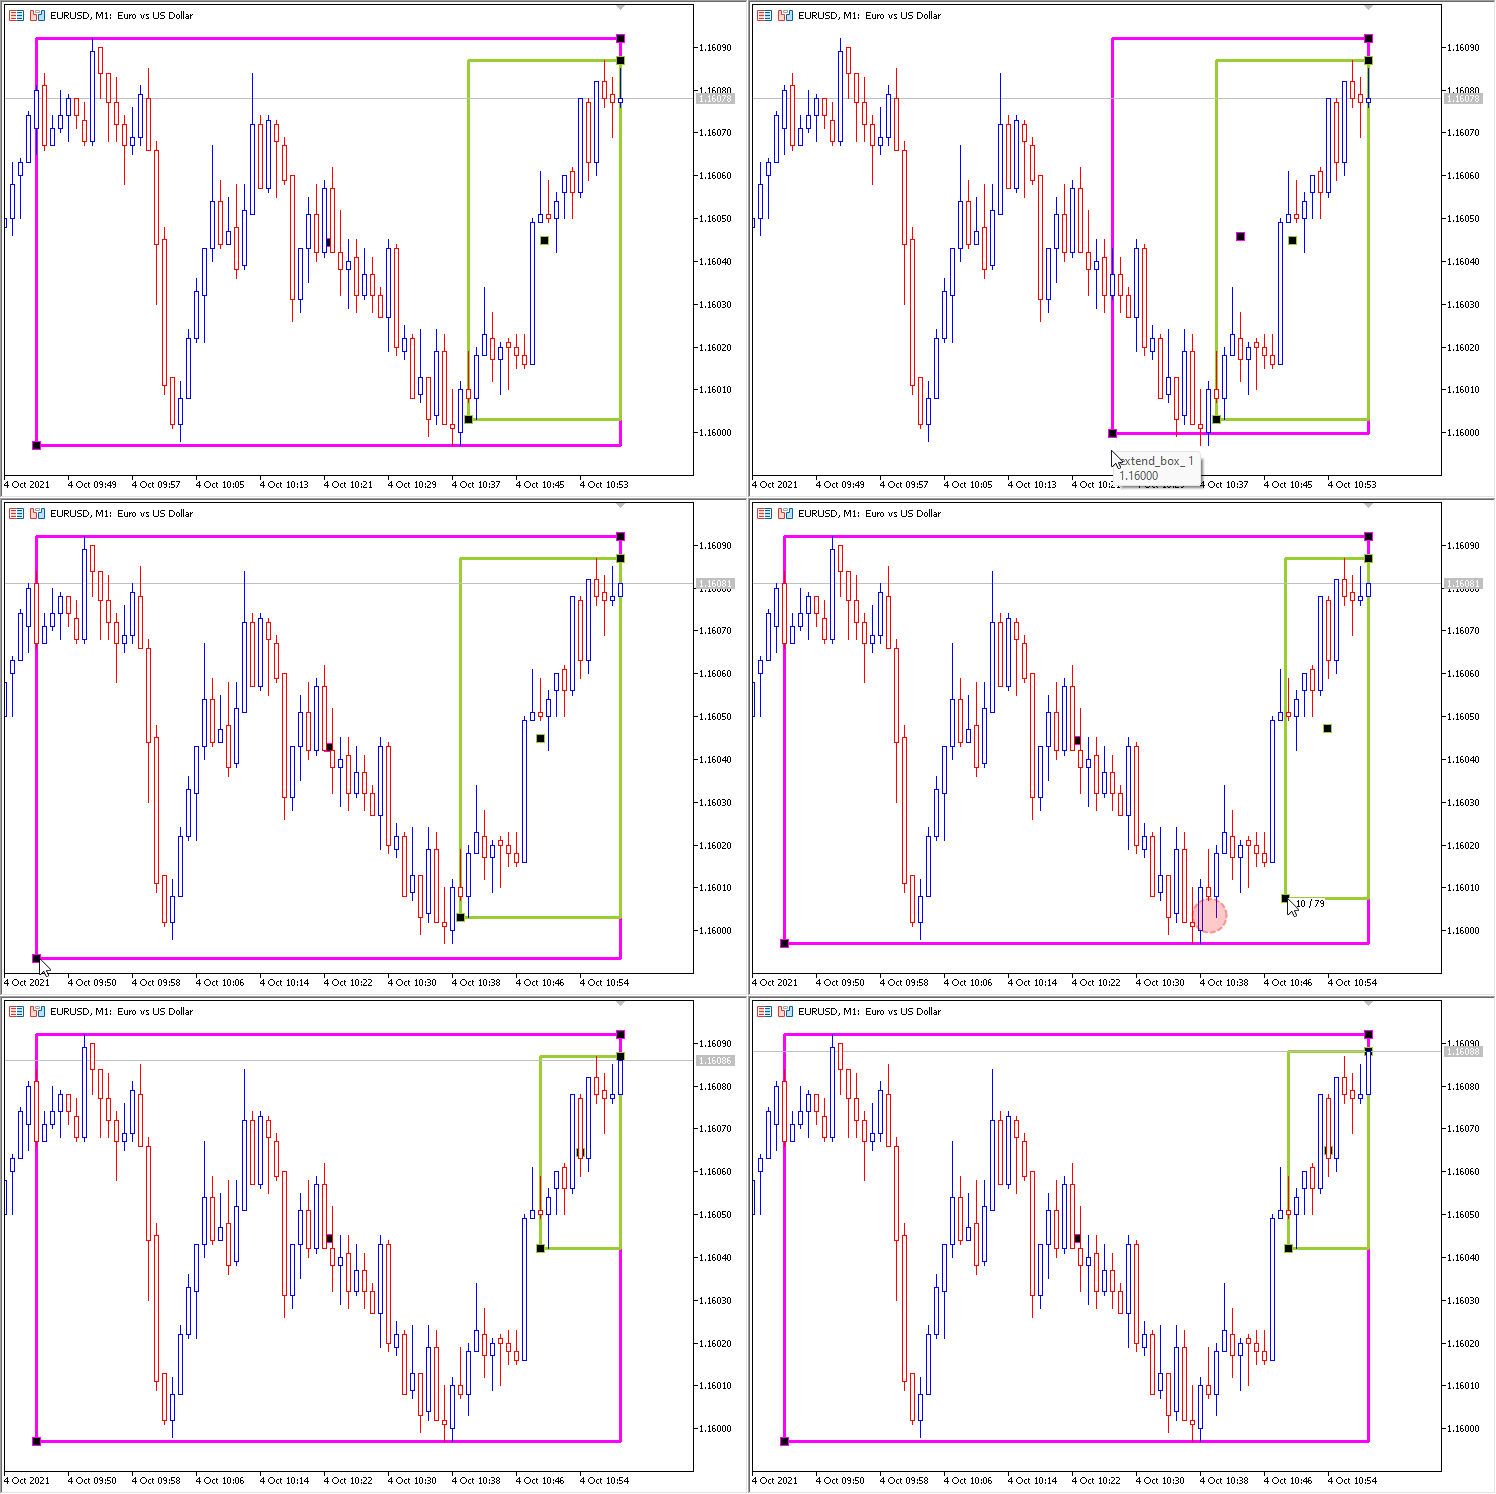
Draw a rectangle on the chart. Change the name on the rectangle on "RECTANGLE"
//+------------------------------------------------------------------+
//|                                                   Extend Box.mq5 |
//|                        Copyright 2015, MetaQuotes Software Corp. |
//|                                             https://www.mql5.com |
//+------------------------------------------------------------------+
#property copyright "Copyright 2015, MetaQuotes Software Corp."
#property link      "https://www.mql5.com"
#property version   "1.00"
#property indicator_chart_window
#property indicator_plots 0
//--- input parametr
input string NameRECTANGLE="RECTANGLE";
//+------------------------------------------------------------------+
//|                                                                  |
//+------------------------------------------------------------------+
int OnCalculate(const int rates_total,
                const int prev_calculated,
                const datetime &time[],
                const double &open[],
                const double &high[],
                const double &low[],
                const double &close[],
                const long &tick_volume[],
                const long &volume[],
                const int &spread[])
  {
   ArraySetAsSeries(time,true);
   ObjectSetInteger(0,NameRECTANGLE,OBJPROP_TIME,1,time[0]);
   return(rates_total);
  }
//+------------------------------------------------------------------+
thanks for sharing
i would be grateful if you could omit the input=RECTABNGLE and change it into unlimite because now we just able to draw only one rectangle.
and secondly if we have the time frame of drawing rectangle as a text at the end would make it really handy for price action traders
would you please do this ???
thanks
I created the following code for manipulating rectangles:
Utility indicator: manages rectangles, always moves the right border along bar # 0

- Free trading apps
- Over 8,000 signals for copying
- Economic news for exploring financial markets
You agree to website policy and terms of use
hi,everybody.
this error what`s the mean?
"no indicator plot defined for indicator"
warning 1
have a good weekend.