Discussing the article: "Non-linear regression models on the stock exchange"
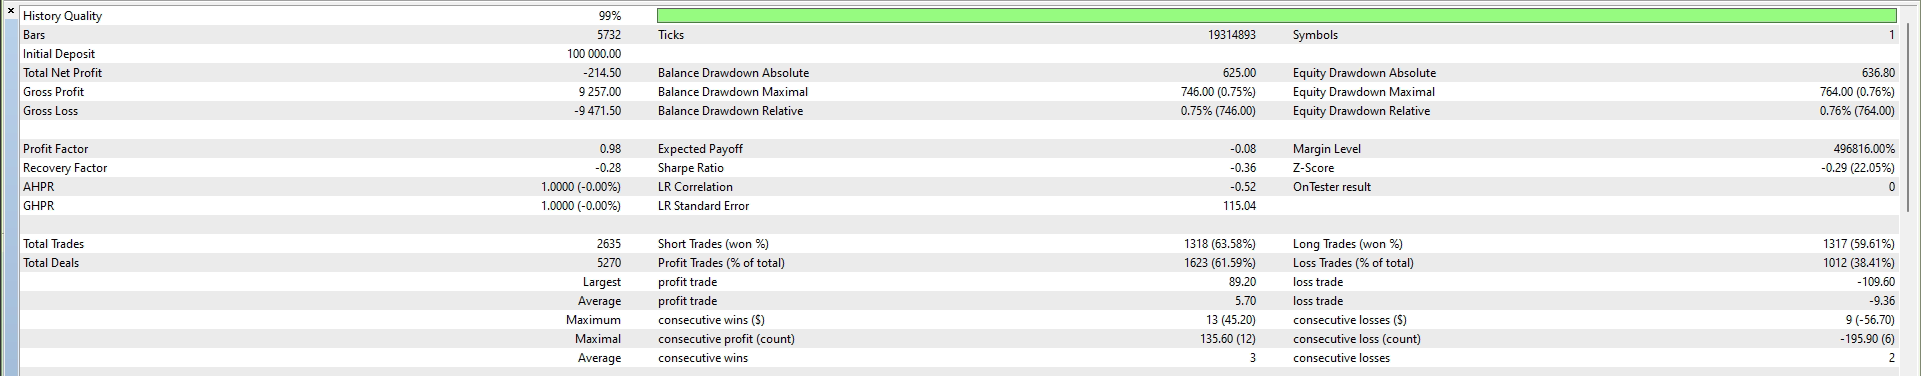
Now, that's very strange:
Было несколько забавных моментов в процессе отладки. Например, система начала выдавать серию противоречивых сигналов буквально каждые несколько минут. Купить, продать, снова купить... Классическая ошибка начинающего алгоритмического трейдера — слишком частые входы в рынок. Решение оказалось до смешного простым — добавил таймаут в 15 минут между сделками и фильтр на открытые позиции.
It turns out that contradictory signals of the model are artificially thinned at random. And if the conditional trading start point is shifted by 15 minutes, will we get trades in other directions at the same time interval?
I like the flight of fancy, attempts to approach the creation of TC from different unusual angles :)
Actually this is the process of creativity, which sometimes leads to the appearance of ingenious solutions.

The forecasts themselves look rather short term:
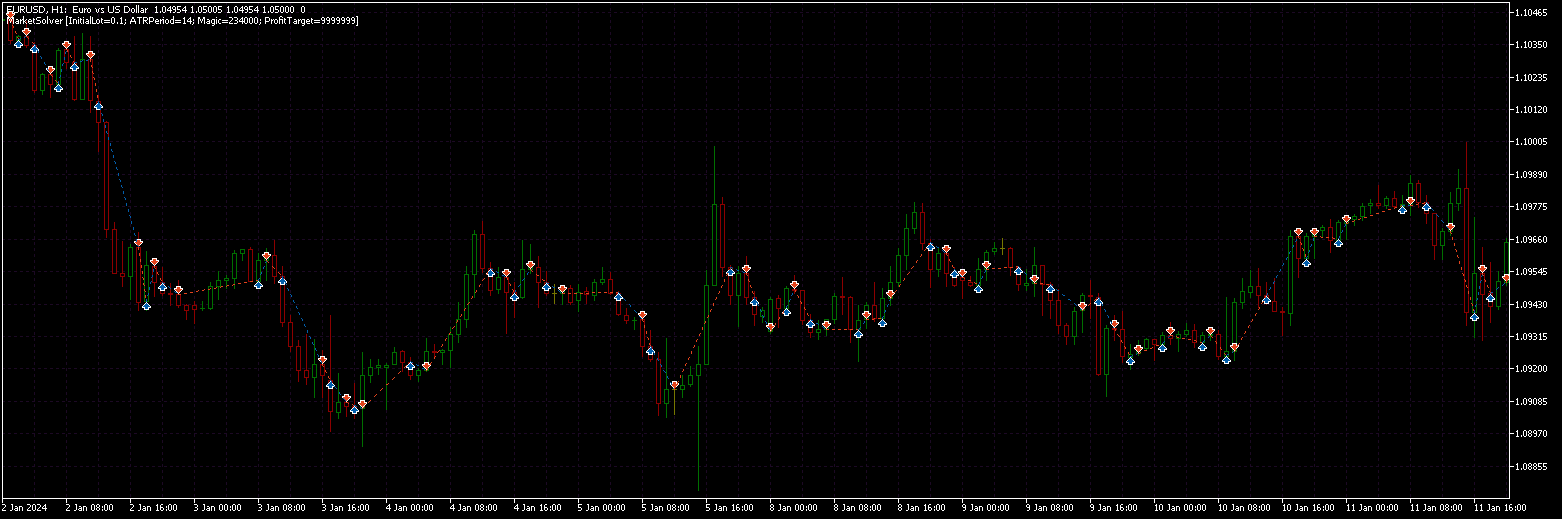
The modified EA is attached (tester version). Closing on profit is disabled by the parameter.
Another thing that caught my eye was the asymmetric signal (forecast >= ask -- buy, forecast < ask (why not bid?) -- sell). But when holding a position for an hour or more, it probably doesn't matter.
Another thing that caught my eye was the asymmetric signal (forecast >= ask -- buy, forecast < ask (why not bid?) -- sell). But when holding a position for an hour or more, it probably doesn't matter.
Have you found the answer to the question?
This is the most important point of any TS, you can not miss signals, otherwise the whole logic collapses, or is it not so here?
Forum on trading, automated trading systems and testing trading strategies.
Discussion of the article "Nonlinear regression models on the stock exchange".
Stanislav Korotky, 2024.11.27 19:05
This is very strange:
It turns out that contradictory signals of the model are artificially thinned randomly. And if the conditional trading start point is shifted by 15 minutes, will we get trades in other directions at the same time interval?
The article is interesting because it clearly shows how few variables are needed to describe the history of price movement with sufficient accuracy to generate profit in the tester.
I just don't understand, the text talks about regular over-optimisations, but it suggests a chart with fixed values. Or are the coefficients there selected with some window frequency and stored in a multidimensional array? Haven't parsed the code.
Have you tried to use other methods to optimise the formula? Andrei Dick is deeply investigating them, maybe one of the algorithms described by him will allow you to abandon python altogether?
- Free trading apps
- Over 8,000 signals for copying
- Economic news for exploring financial markets
You agree to website policy and terms of use
Check out the new article: Non-linear regression models on the stock exchange.
I have spent the last three years trying to create something that actually works. I have tried many things - from the simplest regressions to sophisticated neural networks. And you know what? I managed to achieve results in classification, but not yet in regression.
There was the same story every time - in history everything works like clockwork, but when I release it onto the real market, I face losses. I remember how excited I was about my first convolutional network. R2 at 1.00% on training. This was followed by two weeks of trading and minus 30% of the deposit. Classic overfitting at its finest. I kept enabling forward visualization watching how the regression-based forecast moves further and further away from the real prices, overtime...
But I am a stubborn person. After another loss, I decided to dig deeper and started sifting through scientific articles. And do you know what I dug up in the dusty archives? It turns out that old Mandelbrot was already harping on about the fractal nature of markets. And we are all trying to trade with linear models! It is like trying to measure the length of a coastline with a ruler - the more accurately you measure, the longer it gets.
At some point it dawned on me: what if I try to cross classical technical analysis with non-linear dynamics? Not these crude indicators, but something more serious - differential equations, adaptive ratios. It sounds complicated, but in essence it is simply an attempt to learn to speak the market in its language.
In short, I took Python, hooked up the machine learning libraries, and started experimenting. I decided right away - no academic bells and whistles, just what can really be used. No supercomputers - just a regular Acer laptop, super-powerful VPS and MetaTrader 5 terminal. From all this, the model that I want to tell you about was born.
Author: Yevgeniy Koshtenko