New MetaTrader 5 for iPhone/iPad: Trading report and additional indicators
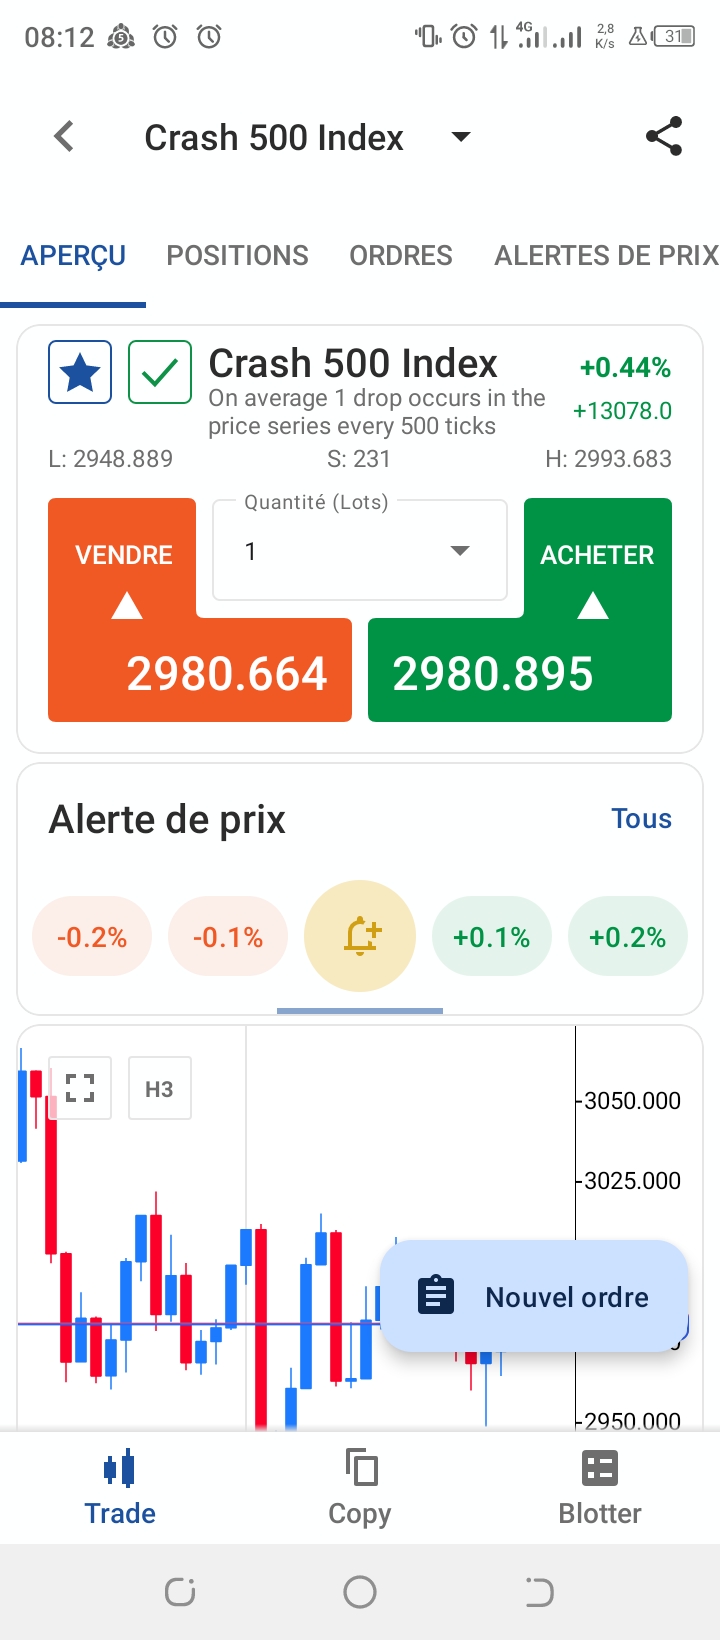
It would be nice if you guys can add a price alarm or an alarm to the metatrader 5 application on mobile device
Please add this feature for Android devices as well.
The trading report will appear in one of the future versions of the MT5 terminal for Android. There is no ETA yet.
Good day, I sincerely hope this definitely reaches you.
May I propose for an addional increase of horizontal indicators above the current 512 quota 🙏🏿🙏🏿🙏🏿?
Sergey El #:
The trading report will appear in one of the future versions of the MT5 terminal for Android. There is no ETA yet.
Looking forward to when this happens!
The trading report will appear in one of the future versions of the MT5 terminal for Android. There is no ETA yet.
Add these Feature
Allow users to set alarm from the app as well.
Allow some risk to reward tools
Add indicators like super trend
app will definitely drive more traders to the app version
You are missing trading opportunities:
- Free trading apps
- Over 8,000 signals for copying
- Economic news for exploring financial markets
Registration
Log in
You agree to website policy and terms of use
If you do not have an account, please register
The latest versions of the MetaTrader 5 mobile app for iOS introduce a range of new features designed to help traders stay abreast of financial markets wherever they are.
The report is divided into tabs, each providing aggregated information:
To add new indicators, open the chart menu, tap Main window and select them from the list. ZigZag is found under trend indicators, while Market Profile belongs to volume indicators.
To view the Heikin Ashi chart, tap on the chart and access the settings.
Install the latest app version and unlock extended trading capabilities: