Retrieving macd maximal and minimal values
Why not just copy the MACD values into array and find the ArrayMaximum() on it?
Hi enivid,
Thank you for your reply:)
That won't help me because I don't need the maximal value of the MACD values, but the maximal value of the MACD vertical scale (in the attached image it is 0.000559).
- 2010.02.25
- MetaQuotes Software Corp.
- www.mql5.com
Hi enivid,
Thank you for your reply:)
That won't help me because I don't need the maximal value of the MACD values, but the maximal value of the MACD vertical scale (in the attached image it is 0.000559).
Hi Etaytch,
That looks like a custom MACD with RSI lines and something else [%R]...not the traditional MACD...?It seems the different MACD/RSI/%R scales in the indicator don't match...so that's the first thing I'd try to fix.
You have a Min/Max...so you can calculate your 70% MACD values...
Your example shows a Max of 0.000559 * 70% = 0.0003913 MACD value
Figure what is the Min/Max for the RSI that fits it in the indicator window.
You can then convert the RSI Min/Max values to match the MACD Min/Max values...
When your RSI converted values crosses that 70% MACD value...then do something...
Hope this helps,
Robert
Hi Robert,
Yes, I'm using 3 indicators: MACD Traditional, RSI and Williams' Percent Range.
At first, I did try to convert the MACD value to those of the RSI, but I found that it is impossible.. The MACD values are constantly changing.. I didn't find and formula for that..
If you have something on mind, please tell me:)
Actually, I don't really need the RSI indicator. I simply need to know what is the 70% value of MACD at each tick.
As said before, if I only needed it for a single timeframe, it wouldn't be a problem.. I can use the WindowPriceMax and WindowPriceMin to calculate the 70% value.
But I can't use those functions for multi-timeframe EA.. Or at lest I don't know how.. Those functions has a single parameter of the window id, but when using it for several ids, I don't really have those windows on the chart.
Thank you for your help:)
- votes: 7
- 2010.01.26
- MetaQuotes Software Corp. | English Russian Chinese Spanish Portuguese
- www.mql5.com
Hi Robert,
Yes, I'm using 3 indicators: MACD Traditional, RSI and Williams' Percent Range.
Actually, I don't really need the RSI indicator. I simply need to know what is the 70% value of MACD at each tick.
As said before, if I only needed it for a single timeframe, it wouldn't be a problem.. I can use the WindowPriceMax and WindowPriceMin to calculate the 70% value.
But I can't use those functions for multi-timeframe EA.. Or at lest I don't know how.. Those functions has a single parameter of the window id, but when using it for several ids, I don't really have those windows on the chart.
Thank you for your help:)
I assumed you had already set a firm Min/Max for your MACD. I see now that you are using the MACD with a floating range.
You can actually pre-set the Min/Max for the MACD yourself...and then
add the 70% line to the indicator level.
That way you have a permanent
level to see if it crosses or not. With pre-set Min/Max, there is no need to calculate that 70% value each time.
Each TF does have it's range limits. You also may need to adjust your 70% level to match your new Min/Max range scale.
Examples -
4hour - try set Min -0.01 and Max +0.01
1hour - try set Min -0.007 and Max +0.007
See attached screen shot for the 1hour.
Without seeing your code or knowing what you want to do with the MACD values, that's the best I can suggest.
Secondly, you will not be able to test your MTF EA's in the MT4 Strategy Tester. You can only test MTF's in MT5.
Hope this helps,
Robert
Hi Etaytch,
I assumed you had already set a firm Min/Max for your MACD. I see now that you are using the MACD with a floating range.
You can actually pre-set the Min/Max for the MACD yourself...and then
add the 70% line to the indicator level.
That way you have a permanent
level to see if it crosses or not. With pre-set Min/Max, there is no need to calculate that 70% value each time.
Each TF does have it's range limits. You also may need to adjust your 70% level to match your new Min/Max range scale.
Examples -
4hour - try set Min -0.01 and Max +0.01
1hour - try set Min -0.007 and Max +0.007
See attached screen shot for the 1hour.
Without seeing your code or knowing what you want to do with the MACD values, that's the best I can suggest.
Secondly, you will not be able to test your MTF EA's in the MT4 Strategy Tester. You can only test MTF's in MT5.
Hope this helps,
Robert
Hi Robert,
Thank you for your suggestions:)
I did try to set fix max and min values and 70% of them on the H1 timeframe, but I got different result from the original settings.
Here is the original template:
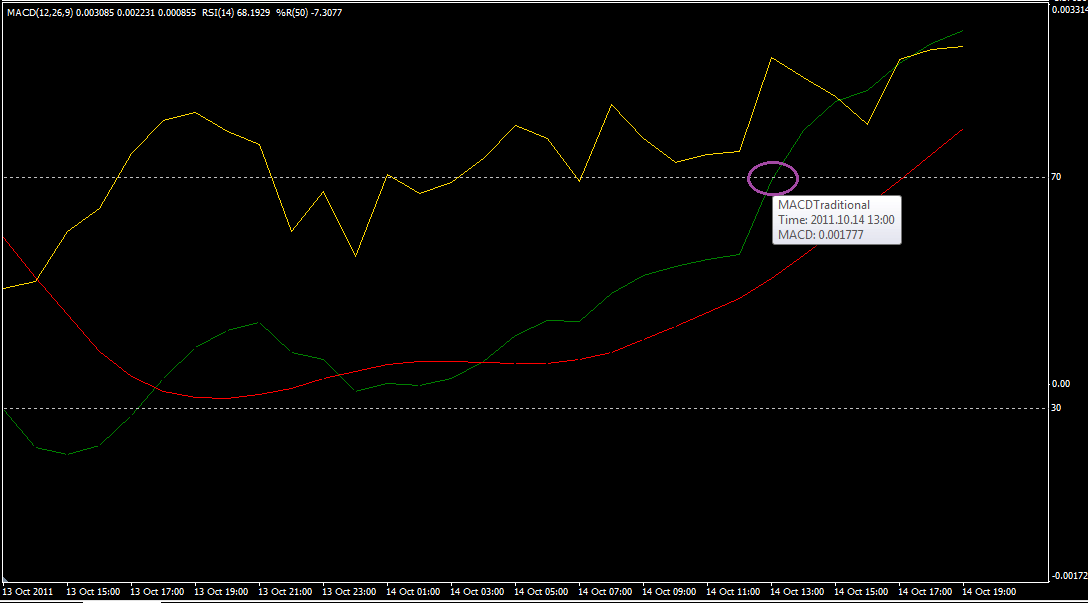
Whereas in the new configured indicator I get the following chart:
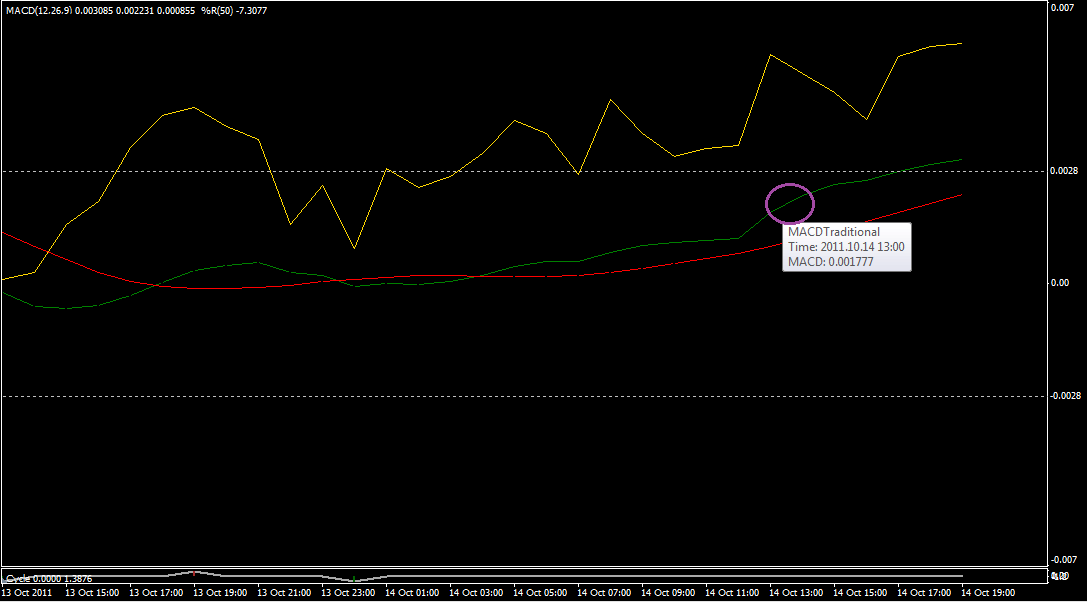
Both purple circles are of the same time (14 Oct 13:00) and value (0.001777), but as a result of the two different vertical scales, the new one is beneath the 70% line as it was originally.
Let me elaborate what exactly I'm trying to do:
Let's say we attach the MACD to a H4 timeframe. Each time the green line crosses the 70% line, I want to check whether or not the same thing happens on the H1 timeframe.
The problem is that in order to calculate the 70% value, I'm using the WindowPriceMax() and WindowPriceMin() values of the subwindow. I can only use them for the H4 timeframe..
Hope you have some more useful suggestions:)
Etay.
Hi Robert,
Thank you for your suggestions:)
I did try to set fix max and min values and 70% of them on the H1 timeframe, but I got different result from the original settings.
Both purple circles are of the same time (14 Oct 13:00) and value (0.001777), but as a result of the two different vertical scales, the new one is beneath the 70% line as it was originally.
Let's say we attach the MACD to a H4 timeframe. Each time the green line crosses the 70% line, I want to check whether or not the same thing happens on the H1 timeframe.
The problem is that in order to calculate the 70% value, I'm using the WindowPriceMax() and WindowPriceMin() values of the subwindow. I can only use them for the H4 timeframe..
Hope you have some more useful suggestions:) Etay.
They don't match because you've changed the scale of the indicator (which is what we wanted)...
I did mention that you may have to re-scale the 70% figure because you just made your Min/Max larger than the first example.
The thought logic for the conversion is...
70% of the Max scale (1st indi) = xx % of the Max scale (2nd indi)...
Because the 2nd indi example has a larger Min/Max scale than the original indicator, you have to adjust the 70% to a lower figure to match the original lines...
Since you already have an exact date/time mark to compare your indicators...
The best way to calculate or find that "new % figure" is to drop
horizontal/vertical lines on the 2nd indicator to make a cross on that
exact spot. That horizontal line will then give you the indicator values to set
your "new % figure"... then you can use that "new % figure" instead of the 70%.
This should eliminate the need to use WPMin() and WPMax() and should work on any timeframe.
Edit - Actually if you set a firm Min/Max for each TF, you can directly establish the fixed "indicator value lines" you need for each TF...and you no longer have to calculate the % of anything. Just use the indicator values themselves to compare and take action:
if (ABC > Indi_H1 && ABC > Indi_H4) Do something ;
Hope this helps,Robert
Hi Etay,
They don't match because you've changed the scale of the indicator (which is what we wanted)...
I did mention that you may have to re-scale the 70% figure because you just made your Min/Max larger than the first example.
The thought logic for the conversion is...
70%of the Max scale (1st indi) = xx %of the Max scale (2nd indi)...
Because the 2nd indi example has a larger Min/Max scale than the original indicator, you have to adjust the 70% to a lower figure to match the original lines...
Since you already have an exact date/time mark to compare your indicators...
The best way to calculate or find that "new % figure" is to drop horizontal/vertical lines on the 2nd indicator to make a cross on that exact spot. That horizontal line will then give you the indicator values to set your "new % figure"... then you can use that "new % figure" instead of the 70%.
This should eliminate the need to use WPMin() and WPMax() and should work on any timeframe.
Edit - Actually if you set a firm Min/Max for each TF, you can directly establish the fixed "indicator value lines" you need for each TF...and you no longer have to calculate the % of anything. Just use the indicator values themselves to compare and take action:
if (ABC > Indi_H1 && ABC > Indi_H4) Do something ;
Hope this helps,Robert
- Free trading apps
- Over 8,000 signals for copying
- Economic news for exploring financial markets
You agree to website policy and terms of use
Hey all,
I'm trying to build an EA that uses the MACD Traditional indicator.
I need to know when the green line crossing 70% of the of current maximal value:
I can get the maximal and minimal values of the macd window using WindowPriceMax() and WindowPriceMin() methods and then calculating a 70% of it.
It does works.
The problem is that I also want to test it on different timeframes at the same time. I can't use the subwindows values because the timeframe is already set before starting the EA.
Hope I've explained it well..
Thanks,
Etay.