Indicators: Second Bars
Only this way, alt + D, no other way.
Well then, the AI suggested it – did you do it? If you did, please let me know whether it helped get rid of the spikes or not.
I’ve never used this indicator; I wrote it simply because it was interesting. It’s easier to work with user-defined symbols, as you can plot a chart and test it in the simulator.
By the way, these aren’t market spikes, are they? They only ever go down on this indicator, don’t they?
Right then, the AI suggested it – did you give it a go? If you did, please let us know whether it helped get rid of the pins or not.
I’ve never actually used this indicator; I wrote it simply because I thought it was interesting. It’s easier to work with user-defined symbols on a one-second timeframe – you can plot a chart there and test it in the simulator.
By the way, those aren’t market spikes, are they? They only ever go down on this indicator, don’t they?
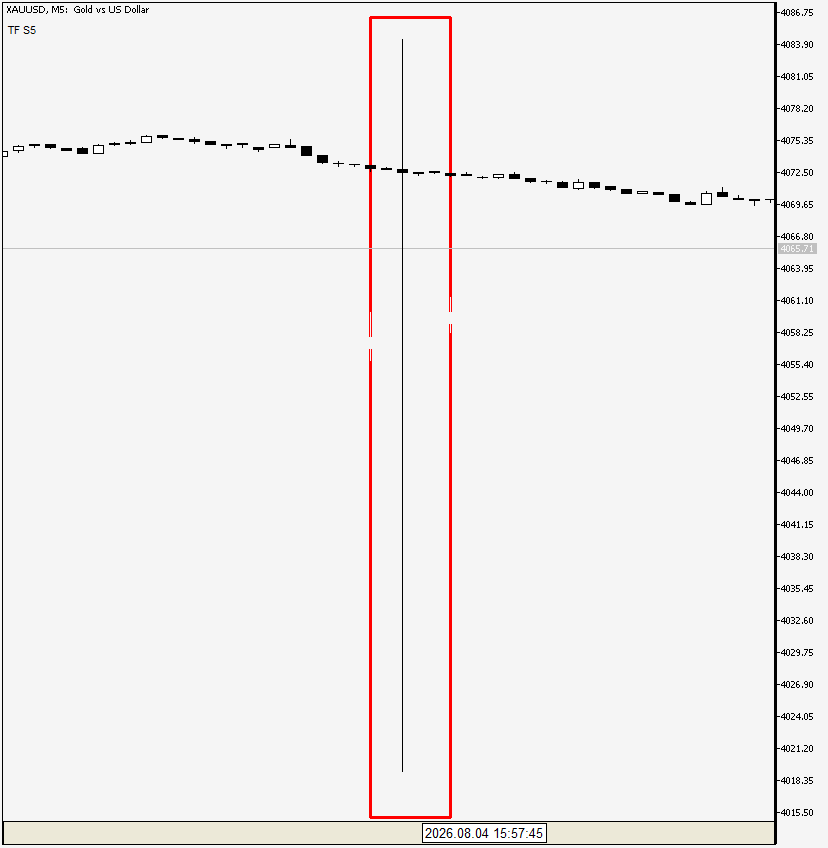
I’ve tried it, but unfortunately it didn’t help. The problem is most likely down to ‘corrupted’ ticks, which MT filters out when plotting charts, but which aren’t filtered out in the indicator. I’ll try to fix it. If I manage it, I’ll let you know.“It’s easier to work with seconds using custom symbols; you can plot a chart there and test it in the simulator” – what’s that about? If it’s not too much trouble, could you explain?
An excellent indicator. Occasionally, a non-market spike appears. The AI (Claude, not the built-in one :) ) suggests correcting the line“for(int j = MathMin( size, rates_total) - 1; j >= 0; j--) // let’s shift all the arrays back by 1 index” – change -1 to -2
Unfortunately, indicators that rely on the OnCalculate() Event Handler are rather notorious for mishandling ticks. In contrast thereto, here's an EA that uses the OnTimer() Event Handler. As an added bonus, you can attach other utilities to the custom chart that the EA generates. Note that the EA doesn't attempt to handle historic ticks, so bars are only generated in forward motion.
Truth be told, I did not code this EA. As no copyright was expressly reserved by the developer, please feel free to give credit where credit is due by posting the developer's name if you know who she/he is.

- Free trading apps
- Over 8,000 signals for copying
- Economic news for exploring financial markets
You agree to website policy and terms of use
Second Bars:
The indicator draws an arbitrary second timeframe on the chart.
Author: Aleksandr Slavskii