Indicators: Auto Scale ZigZag
how to take the value of this indicator programmatically? It gives various results:
double hi=iCustom(sym, per, "ZZM",2,2,5,bar),low=iCustom(sym, per, "ZZM",2,2,6,sh);
It would be much easier, to get only one value of ZigZag indicator at each bar...
But I try all buffer parameters (0-6) no goes...
Improperly formatted code edited by moderator. Please use the CODE button (Alt-S) when inserting code.
looks nice indicator but in visible mode... I mean I can see the ZigZag graph and watching it I can determine the trend and open orders.
But if I need to do it programmatically, I cannot take the coordinate of this graph points from the buffers... because, it give varous result not the exact one compred to the price value (close or open).
So, extremums are clear, however, in other points we see copying data from previous points, not exact values compared to price value...
Anyway, if we could obtain the same visible points programmatically, this would be very useful since the traditional ZigZag does not give sufficient stable result changing its direction frequently...
Anyway...
To get the extremes for your software calculations, you need to scan the buffers: ArrayHighZZ[] , ArrayLowZZ[] .
Dear Evgeniy,
You wrote this:
To get the extremes for your software calculations, you need to scan the buffers: ArrayHighZZ[] , ArrayLowZZ[] .
These arrays I noticed within the Indicator code, and they are the same as the contents of Buffer No 6 and Buffer No 5, if I am not mistaken.
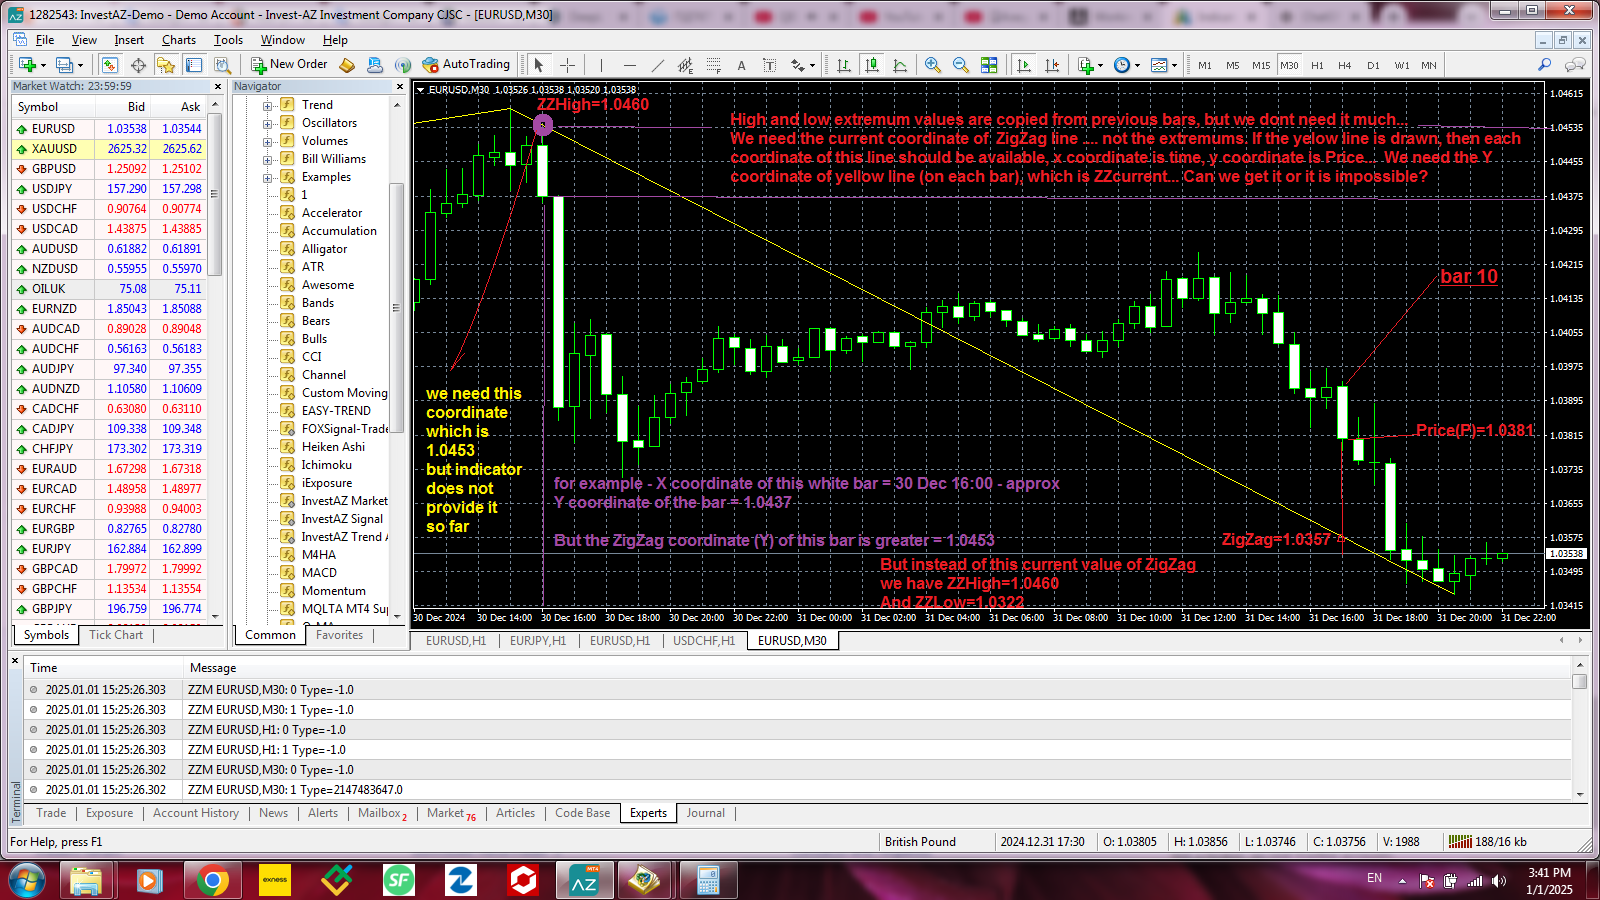
Besides, I dont need the extremum points, I notice the ZigZag line and I need the coordinates of these points on the ZigZag line... according to each bar.
I mean I see for example ZigZag line goes down to let say Bar No 20 (for example) then it turns up until Bar No 5 (for example) and then it is cut... because,
it is probably turning down again. And even in Bar No 0 and Bar No 1, if you check the ZigZag value, it is bigger than price value, which means it is already downtrend.
And it is high time to open Sell order... I can visually see it ... but programmatically, how can I be sure that there was a turndown at bar 5 and now it is going down?
The problem can be easily solved in providing the ZigZag value (or High/Low values) acording to each bar... As it is provided in ordinary traditional ZigZag indicator...
Instead of it, the Indicator offers extremum points of turning poings, whih is not comfortable to find the trend...
If the value of Zigzag (not turning points... but curent point) could be arranged, this indicator can be fantastic in conducting trading... since in ordinary ZigZag the fluctation is very frequent and this one is a new modification
and by Scaling parameter it adds a role of filter to exclude harmful fluctations...
So, we need the ZigZag value of each Bar instead of Extremum (turning angles)...
And the ones you indicated ( ArrayHighZZ[] , ArrayLowZZ[] ) I am afraid wont help...
Thanks for your patience to read this long message through...
And regards.
Bahman
So, we need the ZigZag value of each Bar instead of Extremum (turning angles)...
And the ones you indicated ( ArrayHighZZ[] , ArrayLowZZ[] ) I am afraid wont help...
To be honest, I still didn't understand what was needed. And that is not displayed.
There is an open source indicator code where you can see what is calculated and how, in which everything is signed and what is written to which buffer.
All you need is to get the right values for yourself from the right buffers for your calculations.
Dear Evgeniy,
Thanks a lot for your kind reply. I understand I dont explain my question properly and therefore the picture is stil vague.
I have enclosed a graph with expanation to give you more information about my question...
Along with this, I would add some more words here...
I mean in your buffers one can get information from various buffers, where in one of them it give -1 and +1 which indicates the trend accordingly.
This cannot be used by EA-s acccordingly... simply because, it does not give correct information, like when ZigZag is Downtrend, these figures are both +1 and - 1...
Buffer N5 and N6 cannot be used as well as it does not give information about exact Y coordinate (price) of ZigZig line, it only offers replicated values of previous Extremums... which is not of much demand.
We need the exact value of ZigZag line...not extremum... That is, if I am on bar 5 (for ex) I need not the price value of this bar, but ZigZag value of this bar.. That is intersection of Bar 5 and price value at the ZigZag graph...ent
I hope I could deliver my position. If not, please have a look to this attachment with full illustration...
The indicator has buffers that display the extremes of the zigzag and there are calculated buffers for building the same indicator.
And it doesn't matter if someone likes the information in the calculated buffers or not. They are not created for that, but for building an indicator.
The indicator draws a zigzag polyline. What it copes with and nothing else is provided in it.
- Free trading apps
- Over 8,000 signals for copying
- Economic news for exploring financial markets
You agree to website policy and terms of use
Auto Scale ZigZag:
ZigZag with automatic step size detection for changing wave direction.
Author: Evgeniy Chumakov