How to Display Indicators in a Different Timeframe in an EA?
Hello everyone,
I am trying to display indicators in a timeframe different from the chart's timeframe where the EA is running. For example, the following code works:
However, if I replace PERIOD_CURRENT with another timeframe (e.g., PERIOD_H1 ), the moving average is not displayed if the chart's timeframe is different than PERIOD_H1. The same issue happens with other indicators.
I understand that there’s no need to display indicators in an EA, but I want them to be visible on the chart for this specific use case.
How can I achieve this?
Thanks for your help!
you require a MTF or multi timeframe indicator. You can find them in codebase or marketplace.
Also -- with only few exceptions, mtf indicators are limited to timeframes that are larger than the timeframe that is on the chart.
OR -- just open a new chart with the indicator on the required timeframe, and place the 2 charts beside or overlapping each other.
The answer was already given in post #1.
If you want to display an indicator on a different time frame, you will need to open a separate chart for that different time-frame and add the indicator to it.
You can do that in code with ...
Opens a new chart with the specified symbol and period
Adds an indicator with the specified handle into a specified chart window
If this is not what you want, then please explain in more detail what it really is you wish to achieve.
Hello,
No, the answer has not already been given.
I want to know if it is possible to code my EA to display indicators that are in different timeframes than the one of the chart running the EA. I understand that such behavior is possible by coding indicators, but I want to add this functionality to my EA.
Example: My EA needs to be able to display the moving averages of PERIOD_M15 and PERDIO_H1, while running in a PERDIO_M5 chart.
EAs can internally calculate the equivalent of indicator values, but they can't display "buffers" as indicators do. Only indicators are capable of displaying "buffers".
To display "buffers", you have to code Custom Indicators, and on those custom indicators you can have the "buffers" represent any data you want, including different time frames, which is what multi-timeframe Indicators do.
Then in the EA, use those Custom Indicators via iCustom() function and/or add those indicators to the chart with the ChartIndicatorAdd() function.
That is the definition of displaying a Multi-timeframe (MTF) Indicator. In other words, just use a MTF version of the Moving Average, or ...
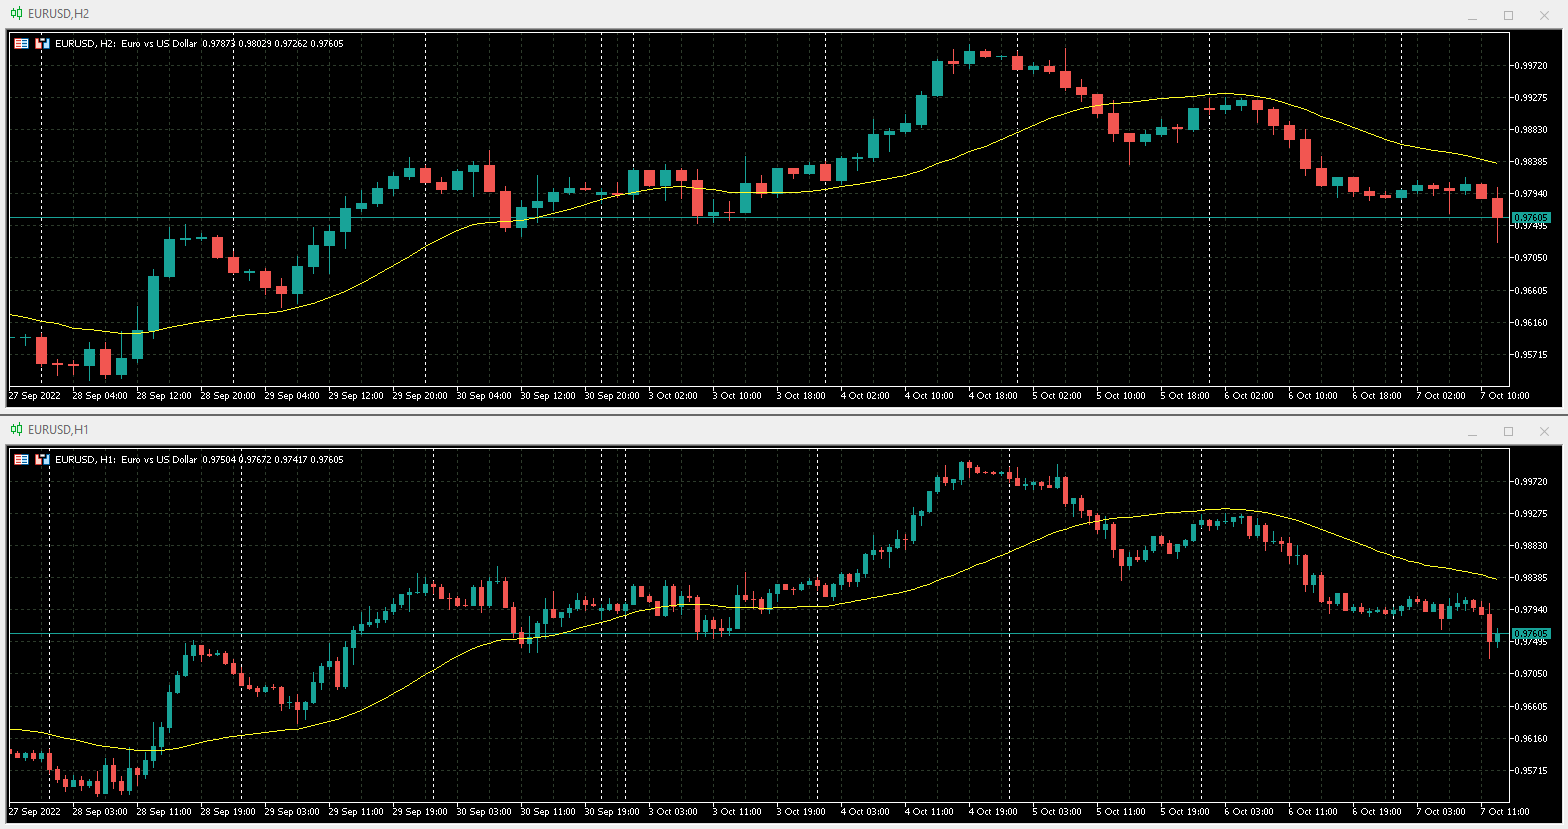
... just scale the Moving Average period to get an equivalent moving average of the different time-frames (see example below).
Example of equivalent periods: A SMA(20) on H2 translates to a SMA(40) on H1. It will obviously be slightly different because H1 has more resolution than H2, but will be equivalent.
- Free trading apps
- Over 8,000 signals for copying
- Economic news for exploring financial markets
You agree to website policy and terms of use
Hello everyone,
I am trying to display indicators in a timeframe different from the chart's timeframe where the EA is running. For example, the following code works:
However, if I replace PERIOD_CURRENT with another timeframe (e.g., PERIOD_H1 ), the moving average is not displayed if the chart's timeframe is different than PERIOD_H1. The same issue happens with other indicators.
I understand that there’s no need to display indicators in an EA, but I want them to be visible on the chart for this specific use case.
How can I achieve this?
Thanks for your help!