What to feed to the input of the neural network? Your ideas... - page 35
You are missing trading opportunities:
- Free trading apps
- Over 8,000 signals for copying
- Economic news for exploring financial markets
Registration
Log in
You agree to website policy and terms of use
If you do not have an account, please register
It is unrealistic to use a year or more of NS without retraining.
If the network can operate for a week or two without retraining (a month at most), this is a great result.
Although some pipsarians retrain the network every 24 hours.
That's why I posted it, nugget. On the simplest ns lasted a year and a bit.
It is unrealistic to use a year or more of NS without retraining.
If the network can operate for a week or two without retraining (a month at most), this is a great result.
Although some pipsarians retrain the network every 24 hours.
I'm already sick of these neurons.
I'll report curious reactions and forget about them for now.
In general, in the process of artistic poking and realisation of my creativity, I tried the following:
1) Dynamic weight: depending on what range the input number from -1 to 1 is in, the weight changes.
Optimisation: range boundaries and weights themselves.
Result: with small architectures it looks more stable than regular MLP.
2) Dynamic weight depending on the pattern from the input data.
Optimisation: weights, the number of which depends on the number of input data, and ranges, based on which (more/less) you can create relations (pattern).
Result - also seemed more stable than the usual MLP.
What does it mean that I have stable? - Absolutely subjective perception of the results of the run obtained when optimising sets, which are less like a random mush, and more areas on the forward, where there was a uniform growth.
Then an idea arose:
The idea is that by giving a strict time sequence of data as input, when moving the window by 1 step, MLP-weights "ruin the picture", giving a completely different result, because the input data and the weights themselves at the new step are very different. Although, it would seem, the pattern of inputs is the same! Just one new input was added, and the oldest one was discarded. But when multiplying by MLP, the information about the pattern moving into the past is simply erased.
I decided to try this scheme .
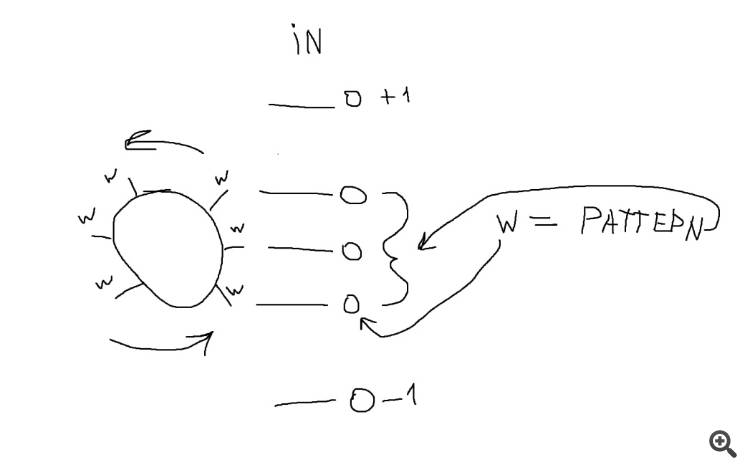
3) Scale drum. When moving the input window to the left, the weights are correspondingly shifted behind them, and on a new (fresh) input we multiply either by the last weight from the previous step, moving the window of weights in parallel with the inputs, or by a new weight, if we want to create a drum of additional weights.
My curves are read from right to left (I don't know why I draw them this way, of course).
Then I screwed the method from points 1 and 2.
Optimisation: all of the above.
Result: no surprise.
The last method came to my mind when I looked at the explanatory picture of CNN convolutional network for a long time.
There was a kind of incompleteness or incompleteness. Probably, I should look at CNN again.
INPUTS:
1) I found the most stable using the ZigZag indicator.
To enter: the ratio of the size of the last "leg" of the zigzag to the size of its other legs.
2) Price hike. That is, depending on the colour of the candle, feed the ratio of its first shadow, second shadow and body to its size.
3) The ratio of the Close1-Close2 increment to the size of candle1. The results liked the fact that there were few "emissions" of equity, its disgusting chatter, or in simple words - over-sitting. Related to this phenomenon is averaging of results when multiplying MLP weights, when the blance grows smoothly, but the equity shakes like hell.
4) The ratio of Close1 to fractals up and down on h1/h4/d1.
All the rest (I may miss something) - more random on the forward and taught period, dirty, ugly, unsmooth, abrupt, disgusting.
But I haven't told about the patterns on the entry from the trend size. I haven't been able to test it normally yet, but zigzag and fractals, as a variant, can speak about the same result, in principle.
.
I have the same neural network structural diagram association - a digital filter
but it's not clear to me
why in all neural network programmes whose codes I read, the coefficient is 1.0 ?
Ideally, if each neuron is a bit of a digital filter, then the coefficients should not be equal to 1.0.
so the coefficients are the predictors and that's what we need to select and feed to the input of the neural network.
and given that the coefficients can be simply calculated using a formula, why go to the trouble of creating a neural network?Ivan Butko #:
...
3) Drum of weights. When moving the input window to the left, the weights are correspondingly shifted behind them, and on a new (fresh) input we multiply either by the last weight from the previous step, moving the window of weights in parallel with the inputs, or by a new weight, if we want to create a drum of additional weights.
My curves read from right to left (I don't know why I draw them that way, of course).
...
INPUTS:
1) I found the most stable using the ZigZag indicator.
Input: the ratio of the size of the last "leg" of the zigzag to the size of its other legs.
...
I ran it in this implementation, I chose the top set, which has 600 trades (all above - 200-something), and the top one with 200~.
Approximately work like this. I couldn't do better.
I have the same neural network structural scheme association - a digital filter
but it's not clear to me
why in all neural network programmes whose codes I read, the coefficient is 1.0 ?
Ideally, if each neuron is a bit of a digital filter, then the coefficients should not be equal to 1.0.
so the coefficients are the predictors and that's what we need to select and feed to the input of the neural network.
and given that the coefficients can be simply calculated using a formula, why go to all the trouble of creating a neural network?Formulate it more simply, for budgetary people, I don't understand what coefficient....
I ran it in this implementation, chose the top set, which has 600 trades starting (all higher ones are 200-something), and the topmost one with 200~.
That's roughly how it works. Couldn't do any better.
Put it more simply, for budgeters, I don't understand what the coefficient is.....
recently posted, found once the answers to almost all questions:
Literature on the disciplines taught (digteh.ru)
the structure of one of the filters
What's not neuronics?
posted a while back, found the answers to almost every question:
Literature on the disciplines taught (digteh.ru)
structure of one of the filters
what's not neuronics?
Holy shit. What a skynet.
If it's good for the trade, thanks for the post.
Holy crap. What a skynet.
If this is good for trade, thanks for the post
And here's another one.
It's practically a replica of the neuronics that everyone here makes.
posted a while back, found the answers to almost every question:
Literature on the disciplines taught (digteh.ru)
structure of one of the filters
what's not neuronics?
This is a BIR filter, they are harder to implement and the phase shifts are nonlinear.
and here's another one
almost a copy of the neuronics that everyone is making here
And this is already a FIR filter, easily calculated in Matlab and very easily implemented in software. And if the card supports OpenCL, such a filter can be parallelised very well. But with OpenCL will not pass in the market, it is purely for yourself or to sell independently. And you can easily calculate filters for free in the online version of Matlab, they give you 20 hours a month for free. The funniest thing is that despite the sanctions, I go from Russia without VPN and my registration is @yandex.ru )). Look for the Apps tab in the top bar and there is a section on filters at the bottom. In Filter Design you can calculate the coefficients. And in the desktop version there is Filter Builder, there you can import the calculated filter as a function and in general, the possibilities are more than online. By the way, it is very easy to convert Matlab functions into Matlab DLLs that can be directly called from MQL5. Matlab has built-in tools for this purpose. The minus is that for such DLLs to work you need to install freely distributed run-time from mathworks, and it used to be more than half a gig, now it is probably even bigger.
Yes, thanks for the link with literature, a lot of interesting material.
These are BIR filters, they are harder to implement and the phase shifts are non-linear.
And this is already a FIR filter, easily calculated in Matlab and very easily implemented in software. And if the card supports OpenCL, such a filter can be paralleled very well. But with OpenCL will not pass in the market, it is purely for yourself or to sell independently. And you can easily and for free calculate filters in the online version of Matlab, they give you 20 hours a month for free. The funniest thing is that despite the sanctions, I go from Russia without VPN and my registration is @yandex.ru )). Look for the Apps tab in the top bar and there is a section on filters at the bottom. In Filter Design you can calculate the coefficients. And in the desktop version there is Filter Builder, there you can import the calculated filter as a function and in general, the possibilities are more than online. By the way, it is very easy to convert Matlab functions into Matlab DLLs that can be directly called from MQL5. Matlab has built-in tools for this purpose. The disadvantage is that for such DLLs to work, you need to install the freely distributed run-time from mathworks, and it used to be more than half a gig, now it is probably even bigger.
Yes, thanks for the link with literature, a lot of interesting material.
Somewhere on the forum there was an EA on Mashka, which made the GPT chat.
The most interesting thing is that the code analyses the MA both in the direction of increasing the number of bars and decreasing.
of course, I did not try to apply this in practice because of repeated fiascoes when using indicators, but I think there is something in it.
---
TC asked a question about trading on MN1.
I think that the idea of such trading, due to the decent lag of indicators, will eventually come down to analysing the economic situation, not the chart.