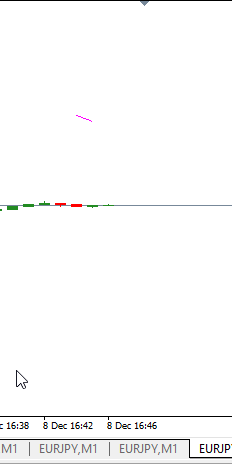
It actually appears to be a vertical line while its actually a diagonal .
The issue is you are projecting the second point to -100 so 141.55 - 100 is 41.55 :)
If you project to -100*_Point , -100 points it will show up properly
Also , you'd need to delete your Hline objects at first so that it allows creation of new ones (that means you probably had the solution and could not see it at some point)
         int i = 100;
         double prediction = 141.550;
         ResetLastError();
         ObjectsDeleteAll(ChartID(),"HLine_");
         // prediction-100 here is a test, normally it should be just prediction to get a horizontal line but in order to show
         // something on the chart I tried drawing a diagonal line. I don't want to use OBJ_HLINE as that will produce a horizontal line across
         // the whole chart, I want just two adjacent candles.
         if(!ObjectCreate(0,"HLine_"+IntegerToString(i),OBJ_TREND,0,Time[i],prediction,Time[i-1],(prediction-100.0*_Point)))
            PrintFormat("Failed to create line, erc = %i", GetLastError());

         ObjectSetInteger(0,"HLine_"+IntegerToString(i),OBJPROP_COLOR,clrBlack);
         ObjectSetInteger(0,"HLine_"+IntegerToString(i),OBJPROP_STYLE,STYLE_SOLID);
         ObjectSetInteger(0,"HLine_"+IntegerToString(i),OBJPROP_WIDTH,1);
         ObjectSetInteger(0,"HLine_"+IntegerToString(i),OBJPROP_BACK,false);
         ObjectSetInteger(0,"HLine_"+IntegerToString(i),OBJPROP_SELECTABLE,false);
         ObjectSetInteger(0,"HLine_"+IntegerToString(i),OBJPROP_SELECTED,false);
         ObjectSetInteger(0,"HLine_"+IntegerToString(i),OBJPROP_HIDDEN,false);
         ObjectSetInteger(0,"HLine_"+IntegerToString(i),OBJPROP_ZORDER,1);
         ObjectSetInteger(0,"HLine_"+IntegerToString(i),OBJPROP_RAY_RIGHT,false);
It actually appears to be a vertical line while its actually a diagonal .
The issue is you are projecting the second point to -100 so 141.55 - 100 is 41.55 :)
If you project to -100*_Point , -100 points it will show up properly
Also , you'd need to delete your Hline objects at first so that it allows creation of new ones (that means you probably had the solution and could not see it at some point)
Thanks for your response.
I was aware that I needed to do the ObjectDeleteAll command so I put it in the deinit() section.
When I change and use the 100.0*_Point in the ObjectCreate command it doesn't display anything on the chart. Any further ideas?
Update 8:12:22
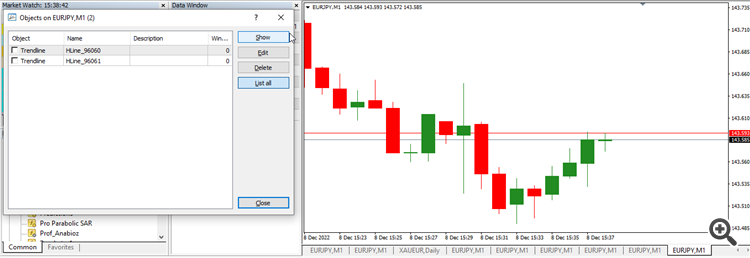
In the Objects list the HLine_xxxx object appears and I can delete it. When I click on Show it takes me to the position is drawn at but there is nothing drawn on the screen.
From my code you can see that I have this line included:
ObjectSetInteger(ChartID(),"HLine_"+IntegerToString(i),OBJPROP_HIDDEN,false);
so it should display something. Ant other ideas?
Thanks for your response.
I was aware that I needed to do the ObjectDeleteAll command so I put it in the deinit() section.
When I change and use the 100.0*_Point in the ObjectCreate command it doesn't display anything on the chart. Any further ideas?
Update 8:12:22
In the Objects list the HLine_xxxx object appears and I can delete it. When I click on Show it takes me to the position is drawn at but there is nothing drawn on the screen.
From my code you can see that I have this line included:
so it should display something. Ant other ideas?
It actually displays it , if you zoom in you will see it i think , tricked me too .
Or you could change the end time to be
iTime(NULL,0,0) or Time[0]
It actually displays it , if you zoom in you will see it i think , tricked me too .
Or you could change the end time to be
iTime(NULL,0,0) or Time[0]
I've changed the ObjectCreate command to this:
ObjectCreate(ChartID(),"HLine_"+IntegerToString(i),OBJ_TREND,0,iTime(NULL,0,
1 ),prediction,iTime(NULL,0,0),prediction-100.0)
and it draws a vertical line. Changing the command to this:
ObjectCreate(ChartID(),"HLine_"+IntegerToString(i),OBJ_TREND,0,iTime(NULL,0,1),prediction,iTime(NULL,0,0),prediction-100.0*_Point)
doesn't display anything (I've looked hard even on zoom. I've also changed the colour to clrMagenta.
When I change the command to:
ObjectCreate(ChartID(),"HLine_"+IntegerToString(i),OBJ_TREND,0,iTime(NULL,0,0),prediction,iTime(NULL,0,-1),prediction-100.0)
it doesn't display anything. Same thing for this command:
ObjectCreate(ChartID(),"HLine_"+IntegerToString(i),OBJ_TREND,0,iTime(NULL,0,0),prediction,iTime(NULL,0,-1),prediction-100.0*_Point)
nothing.
Here's a screenshot for the second command above (*_Point one):
I should mention that I'm doing something strange to the loop before ObjectCreate code. I'm testing one candle and doing the following (hence the reason for the high HLine_xxxx value):
   int lookback = 100;
   int limit = Bars - 1 - MathMax(lookback, prev_calculated);
//--- the main loop of calculations

   datetime t = StringToTime("2022/09/06 19:51");
   int j = iBarShift(NULL, _Period, t);
   //for(int i = limit; i >= 0 && !IsStopped(); --i)
   for(int i = j; i >= j && !IsStopped(); --i)
     {
        //ObjectCreate code
     }
I've changed the ObjectCreate command to this:
and it draws a vertical line. Changing the command to this:
doesn't display anything (I've looked hard even on zoom. I've also changed the colour to clrMagenta.
When I change the command to:
it doesn't display anything. Same thing for this command:
nothing.
Here's a screenshot for the second command above (*_Point one):
I should mention that I'm doing something strange to the loop before ObjectCreate code. I'm testing one candle and doing the following (hence the reason for the high HLine_xxxx value):
The loop is accessed once anyway so that's okay , redundant but okay.
Then theres iTime(NULL,0,-1) which returns 1970 , try this instead :
ObjectCreate(0,"HLine_"+IntegerToString(i),OBJ_TREND,0,Time[i],prediction,Time[0],(prediction-100.0*_Point))
ObjectCreate(0,"HLine_"+IntegerToString(i),OBJ_TREND,0,Time[i],prediction,Time[0],(prediction-100.0*_Point))
Do not use series index in object names, as they are not unique. As soon as a new bar starts, you will be trying to create a new name (e.g., “name0”), same, existing, previous, name (e.g., “name0” now on bar one.)
Use time (as int) or a non-series index:
#define SERIES(I) (Bars - 1 - I) // As-series to non-series or back.
The loop is accessed once anyway so that's okay , redundant but okay.
Then theres iTime(NULL,0,-1) which returns 1970 , try this instead :
Thanks for baring with me!
I tried what you suggested and it worked. I then modified the Time[i] to be Time[1] and it displayed ok. However, I needed to minimize the scale to see the line. Here's a screenshot:

Thanks for your help! :-)
Thanks for baring with me!
I tried what you suggested and it worked. I then modified the Time[i] to be Time[1] and it displayed ok. However, I needed to minimize the scale to see the line. Here's a screenshot:
Thanks for your help! :-)
Excellent . Cheers .
Do not use series index in object names, as they are not unique. As soon as a new bar starts, you will be trying to create a new name (e.g., “name0”), same, existing, previous, name (e.g., “name0” now on bar one.)
Use time (as int) or a non-series index:
Good observation
Do not use series index in object names, as they are not unique. As soon as a new bar starts, you will be trying to create a new name (e.g., “name0”), same, existing, previous, name (e.g., “name0” now on bar one.)
Use time (as int) or a non-series index:
Thanks for your advice.
- Free trading apps
- Over 8,000 signals for copying
- Economic news for exploring financial markets
You agree to website policy and terms of use

Hello,
I'm using this code to try and draw a horizontal line between two adjacent candles.
However, instead of a horizontal line I'm getting a vertical line (not a diagonal as per the above code) along the same candle like so:
What am I doing wrong please?