Canvas vs Labels - page 7
You are missing trading opportunities:
- Free trading apps
- Over 8,000 signals for copying
- Economic news for exploring financial markets
Registration
Log in
You agree to website policy and terms of use
If you do not have an account, please register
Is there any information where you can read more about this somewhere? Although it's pretty clear to me, it's still an interesting topic! Now it remains to do the bitmap update control variant and test it. I'll be surprised if the bitmap turns out to be faster than the labels.
On the speed of Canvas, there's a question.
The video card is built into the CPU.
Running code like this.
In brief it measures how much time OnTimer is executed each 100 ms. Besides, it plots a graph of measurements inside OnTimer. This is what it gets.
It eats up 15-20%. Apparently, it's a slow graphics card. But the issue is different. If I start jerking a price chart with a mouse (when holding down the left mouse button and moving it left-right), the load increases twofold. It is clearly visible on the animation above. What is the reason for this peculiarity?
Once again. OnTimer takes twice as long if you move the price chart with the mouse.
On the speed of Canvas, there's a question.
The video card is built into the CPU.
Running code like this.
Briefly, it measures how much time OnTimer is executed each 100 ms. Besides, it plots a graph of measurements inside OnTimer. This is what it gets.
It eats up 15-20%. Apparently, it's a slow graphics card. But the issue is different. If I start jerking a price chart with a mouse (when holding down the left mouse button and moving it left-right), the load increases twofold. It is clearly visible on the animation above. What is the reason for this peculiarity?
Once again. The OnTimer takes twice as long if you move the price chart with the mouse.
Most likely your libraries have CHARTEVENT_CHART_CHANGE control, in order to change canvas size in case of need (if the chart size has changed), but to find it out you need to run terribly slow (so far) asynchronous function ChartGet...
This leads to slowness.
It would make more sense for MQ to separate CHARTEVENT_CHART_CHANGE event, and make separate CHARTEVENT_CHART_SIZE_CHANGE, for example. There is too much stuff in CHARTEVENT_CHART_CHANGE event: new bar coming, bars scrolling, vertical price scale change, window resizing.
It's quite possible that with a small number of Labels their usage has speed advantages over Kanvas because BitMap is filled out in C++ and not in MQL5. However, it is unlikely, the formation of the text should be the same in canvas as well, because the formation of text BitMap is performed by win-functions in both cases. I think in the case of Label these objects are also clad with event-driven properties (they can be dragged and dropped with mouse) and it makes their construction heavier in the end.
Indeed, labels can be faster. Depends how many are in the chart... Did an update check and was indeed surprised by the results. Limit taken from the minimum frame rate pleasing to the eye, 24 fps, if I'm not mistaken. Got about 41 milliseconds. Put a limit on Kanvas and, oh wonder, I was surprised. It just flies, compared to the relentless updating of the labels! But when I put the same restriction for the display on the Labels, it was even faster than the Kanvas based display. But I won't get ahead of myself, I'll present all the test results later.
If I start jerking the price chart with the mouse (move left and right with the left mouse button pressed), the load doubles. In the animation above it is perfectly visible. What is the reason for this peculiarity?
With Windows event model - even if you move the mouse quickly, the load on the CPU starts increasing, no matter what application was in focus
SZY: checked with Win10 task manager... I don't think Win10 has changed the event model dramatically, it's more likely the task manager works differently
Most likely your libraries have CHARTEVENT_CHART_CHANGE control in order to change canvas size in case of need (if the chart size has changed), but to find it out you need to perform terribly slow (so far) asynchronous ChartGet function...
This leads to braking.
It would make more sense for MQ to separate CHARTEVENT_CHART_CHANGE event, and make separate CHARTEVENT_CHART_SIZE_CHANGE, for example. The CHARTEVENT_CHART_CHANGE event has a lot of stuff: new bar coming, bars scrolling, vertical price scale change, window resizing.
None of this is in the code above.
with the Windows event model - even if you move the mouse quickly, the CPU load starts to increase, no matter what application was in focus
SZY: Checked it in task manager in Win10... Not showing any increase in CPU load for some reason, in Win7 the load was increasing on the same PC if I moved the mouse quickly - I doubt Win10 have fundamentally changed the event model, most likely the task manager works differently
Thanks, didn't know that. Surprised that the mouse is able to slow down the MQL program by half.
ZS Is it just me who got this result?It eats up 15-20%. Apparently the video card is slow.
Thank you, I didn't know that. I was surprised that a mouse is able to slow down an MQL program by half.
Then it's legitimate to have lags with ticks and stuff. HFT with such an event model is like a minefield.
None of this is in the code above.
Yeah, didn't see that it's the internal chart.
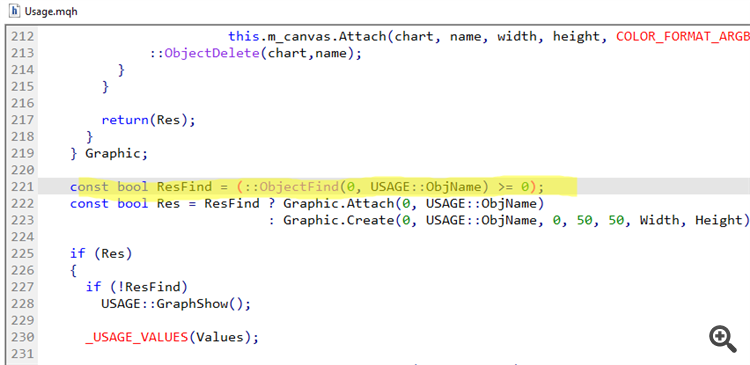
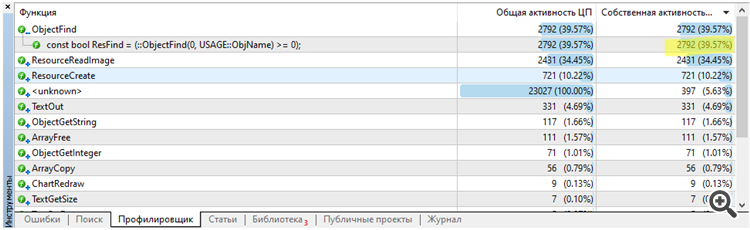
Well judging by the profiling, the source of the brakes when scrolling the chart is on this line:
Profiling with active scrolling:
Profiling with active mouse movement without scrolling (without the LKM pressed):
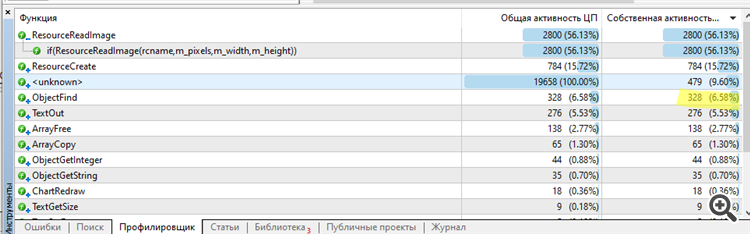
ZS: So the source of the brakes isn't the kanvas, but the objects.
You could have checked it on the chart as well. However, I thought it would be easier to do it in the tester.
This is a flawed approach. Especially since the visual tester has a different delayed rendering model, so as not to completely slow down the testing process.
So, as you said, it takes more time to draw text in labels than to draw OBJ_BITMAP_LABEL.
I did not say so.
I pointed out the obvious errors and explained how the rendering system works.