My dissatisfaction to the strategy tester. to the MQL developers - page 2
You are missing trading opportunities:
- Free trading apps
- Over 8,000 signals for copying
- Economic news for exploring financial markets
Registration
Log in
You agree to website policy and terms of use
If you do not have an account, please register
Renat, I'll take this opportunity to ask, since you're here. Will there be services in the new build or is it postponed for now?
Later.
In the meantime, you can write datafeeds for synthetic instruments without them.
Later.
In the meantime, I can write datafeeds for synthetic tools without them.
I want multithreading, I was hoping that somehow it could be done with services. I personally do not need datafeeds yet.
Good day to you all.
No, this post isn't bullshit like someone else wrote.
I'm on full serge.
I understand what programmers write and say works, but I'm sorry.
If we all work with erroneous data on the broker, I get the idea right away, my results are not erroneous.
The thing is that I may have ironically studied at university to be a statistical engineer.
So for me erroneous data is in general false data accordingly to say 99% that what I see works I as a man of statistics say I do not know the same say you and all who this post read.
The solution is what I wrote above.
Collecting ticks everyone can do with simple robot/algorithm.
The fact is that neither in 5 nor in 4 MQL we have the market data, that should be used for strategy testing.
For long term strategies, I do not think a robot is needed.
For me it is ticks for ticks and I have interesting ideas for studying asc and bid by tick.
Sorry for the long reply and time, I've been really busy.
Sincerely Ivan S.
I wrote once, I'll find it.
For fivehttps://www.mql5.com/ru/code/18046
For fourhttps://www.mql5.com/ru/code/18047
For a six,https://www.mql5.com/ru/code/.
You'd be surprised, but it's the same for 5 and 4.
I can speak for 4 and 5 at the same time!
I have not read the full code of your algorithm but basically this part of the code is for saving but now I need to reproduce this Ask and have the Strategy Tester output it.
If there are any programmers who can do this I am listening very carefully!
If I'm not mistaken, in mt5 the tester is on real ticks where bid/ask is real?
Renat checked that mql5 works the same way as in 4 mql.
Renat checked that mql5 works the same way as with 4 mql.
the issue has been solved long time ago.
1. The question has already been solved. For MQL5 the testing on real ticks has been available for about a year. If only you had studied the terminal...
2. For MQL4, you can use your own tick .fxt files. The easiest way is using TickStory Lite, it downloads real ticks from Ducas
renat checked that mql5 works the same way it sets a fixed spread. as in 4 mql.
a lie
We take my Expert Advisor for ticks saving SaveTicks, the link to CodeBase I gave above, and run it in the tester in mode"Every tick based on real ticks". Let's see what's in the output file, in my case \Tester\Agent-127.0.0.1-3000\MQL5\Files\EURUSD_SaveTicks.csv
2017.11.28 09:11:16,1.1895,1.18952
2017.11.28 09:11:16,1.1895,1.18952
spread 2
2017.11.28 09:11:26,1.18947,1.18951
2017.11.28 09:11:26,1.18947,1.18951
Look at the character browser, and there are ticks for any characters.
These are the actual ticks used in the tester.
Good day to you all.
No, this post isn't bullshit like someone else wrote.
I'm on full serge.
I understand what programmers write and say works, but I'm sorry.
If we all work with erroneous data on the broker, I get the idea right away, my results are not erroneous.
The thing is that I may have ironically studied at university to be a statistical engineer.
So for me erroneous data is in general false data accordingly to say 99% that what I see works I as a man of statistics say I do not know the same say you and all who this post read.
The solution is what I wrote above.
Collecting ticks everyone can do with simple robot/algorithm.
The fact is that neither in 5 nor in 4 MQL we have the market data, that should be used for strategy testing.
For long term strategies, I do not think that a robot is needed.
For me it is ticks for ticks and I have interesting ideas for studying asc and bid by tick.
Sorry for the long reply and time, I've been really busy.
Sincerely Ivan S.
What about your grammar? //Just saying...
If everything is so serious, the solution to your question is as follows:
Gather statistics, quote history and work, Alexey Volchansky has already found everything for you and gave links above.
On the Ask - you can download the history with Ask and Bids from DucasCopy (google it).
Good luck!Here are some interesting articles:
In addition, in yesterday's beta of MetaTrader 5, to which you can upgrade from MetaQuotes-Demo, there is a full-fledged formula system of creation of custom symbols.
You can now create synthetic financial instruments - instruments based on one or more existing ones. You just need to specify the formula for calculating the quotes, and the platform will generate the ticks of the synthetic instrument in the real-time mode and create its minute history.
How it works
- You create a synthetic symbol and set a formula for it.
- The platform will calculate its ticks at a rate of 10 times per second (and only if the price of at least one instrument included in the formula has changed).
- The platform will calculate the history of the minute bars (for the last two months) based on the minute bars of the instruments included in its formula. All new bars (current and subsequent) will be built in real time based on the generated ticks of the synthetic instrument.
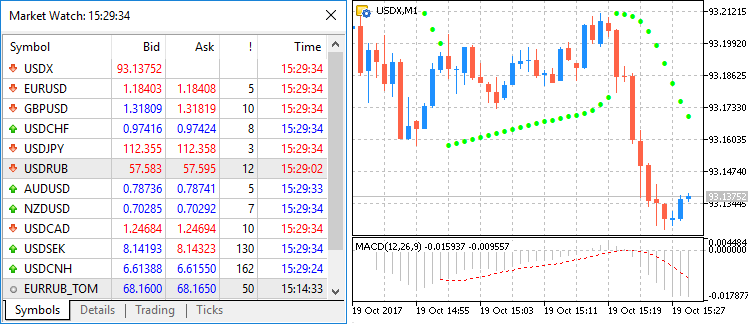
For example, you can create a tool, which will show the dollar index (USDX). Its formula will look as follows:Note: the original dollar index formula uses USDEUR and USDGBP pairs. As the platform only has inverse currency pairs, the synthetic tool formula uses negative degree for them and the Ask price instead of Bid.
In real time, the platform will calculate the price of the new instrument based on the quotations of the six other instruments provided by your broker. In the Market Watch and on the chart, you will see how its price is changing:
Create a new custom instrument, open its specification and specify the formula:
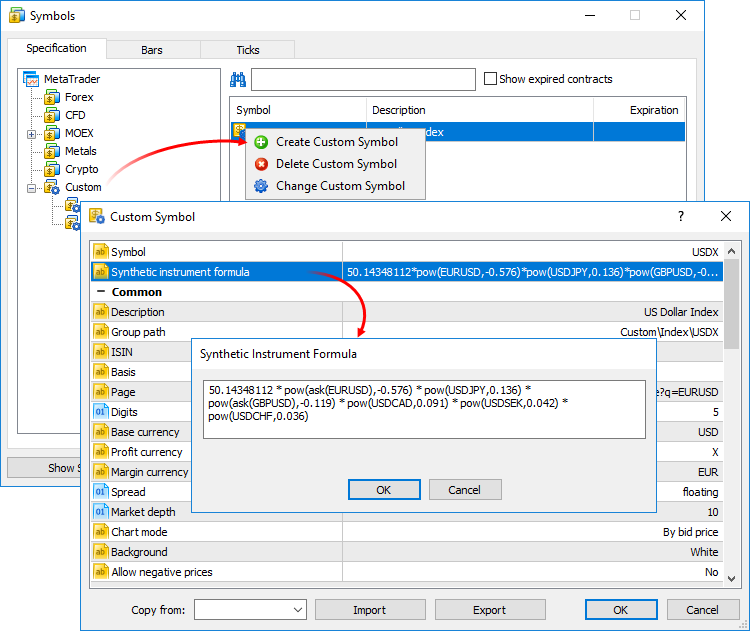
For convenience, the formula editor shows a list of possible options as you enter instrument and function names.The calculation of ticks and minute bars of the synthetic instrument will start when it is added to "Market Watch". All symbols necessary for its calculation will be automatically added to the "Market Watch" immediately. A record of the start of the calculation will be added to the platform's log: Synthetic Symbol USDX: processing started.
Calculating quotes in real time
Every 100 ms (ten times per second) we check if the price of at least one instrument involved in the formula has changed. If so, the synthetic instrument price is calculated and a tick is generated. The calculation is performed in parallel in three streams for Bid, Ask and Last prices. For example, if EURUSD*GBPUSD is specified in the formula, the synthetic instrument price calculation will be as follows:
The presence of changes is checked for each price separately. For example, if in the next calculation only the Bid price of the initial instrument has changed, then only the price, where there were changes, will be calculated for the tick of the synthetic instrument.
Building the history of minute bars
In addition to collecting ticks in real time, the platform also creates a minute history of a synthetic instrument. Thus, a trader can view its charts as if they were regular instruments and perform technical analysis on them using objects and indicators.
As soon as the trader adds a synthetic instrument to the Market Watch, the platform checks whether there is a minute history calculated for it. If not, it will be created for the last 60 days, which is about 50,000 bars. If the max bars in the window in the platform settings have a lower value, this is the limit that will be used.
If some of the bars in this period are already built, the platform will create new ones. A deeper history is created only when trying to view the corresponding timeframe on the chart (if you scroll back or request the history from the MQL5 program).
The history of the minute bars of a synthetic instrument is calculated based on the minute bars (not ticks) of the instruments included in its formula. For example, to calculate the price of the Open minute bar of a synthetic instrument, the platform takes the prices of the Open instruments included in its formula. The prices of High, Low and Close are calculated in the same way.
If you do not have a minute bar in the formula for a symbol, the platform will calculate the Close price of the previous bar. For example, you can use three symbols: EURUSD, USDJPY and GBPUSD. If USDJPY does not have a minute bar corresponding to 12:00, the following prices will be used for the calculation:
If all symbols in the formula do not have a minute bar, the corresponding synthetic minute bar will not be calculated.
Construction of new mini bars
All new bars (current and next) in the synthetic tool are created based on the ticks generated. The price at which the bars are built depends on the "Chart construction" parameter in the specification:
What operations can be used in the tool formula
You can use price data as well as some properties of the available symbols (provided by your broker) in your formula. To do this, specify:
There is a priority for arithmetic operations:
Constants can also be used in the formula:
Also all mathematical functions supported in MQL5 can be used in the formula, except MathSrand, MathRand and MathIsValidNuber. Only short names are used for all functions: fabs(), acos(), asin(), etc.