EURUSD signal
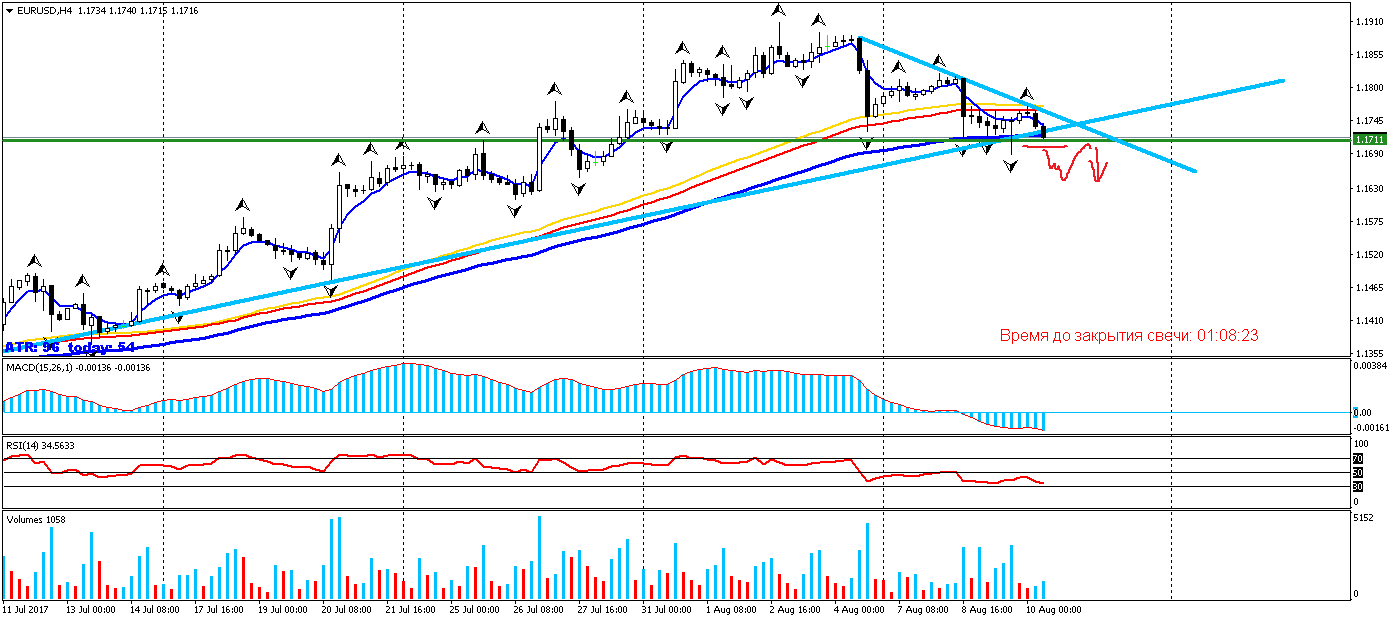 If it gets below 1.1711, I will go short
I see you know how to draw trend lines(no)
The bottom one was broken through a long time ago. What you are drawing has no value anymore. I mean the bottom line. you could have found the top from last year in the same way.
I see you know how to draw trend lines(no)
The bottom one was broken through a long time ago. What you are drawing has no value anymore. I mean the bottom line. you could have found the top the same way from last year.
That's correct. Even the first lower extremum was broken there, pure ABC H1. On H4 there is a long divergence, judging by the MACD, which has depleted. The author seems to want to enter on a breakdown of a(C) H1 wave towards the whole ABC H1 cycle
I see you know how to draw trend lines(no)
The bottom one was broken through a long time ago. What you are drawing has no value anymore. I mean the bottom line. you could have found a top from last year as well.
The 1.1711-1.1713 levels are from two years ago namely 23 August 2015. The pair recently updated it and went back up to 1.1711 - 1.1713.
From the level of 1.1140 the price went upwards. I believe that these lines are still relevant. Purely my opinion.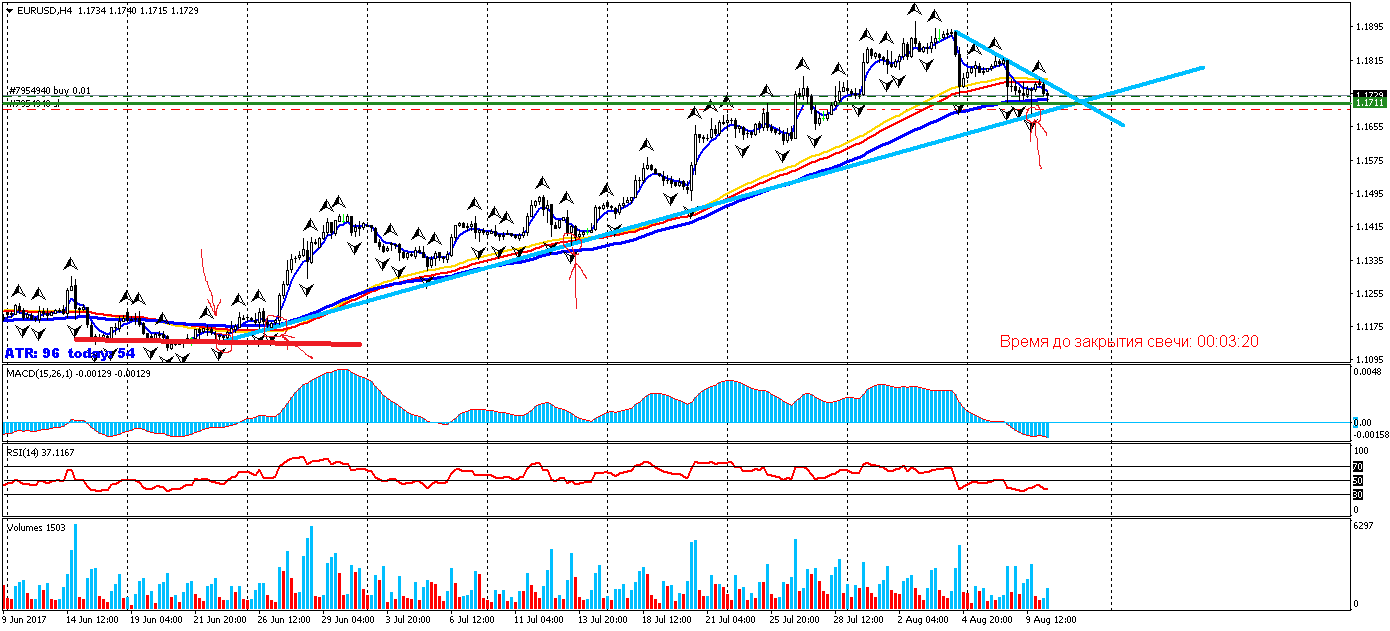
That's correct. Even the first lower extremum was broken there, pure ABC H1. On H4 there is a long divergence, judging by the MACD, which has depleted. The author seems to want to enter on the breakdown of wave a(C) of M15 towards ABC H1
No question about it. Build the lines however you want, I showed in another thread how you should build the lines. How can you navigate on something that has already been broken through???
How can you even navigate lines that are constantly changing, punching, tilting back and forth, always lagging, etc.?
I'm sorry, what? Are the lines lagging? did you say you understood it yourself?
I'm sorry, what? The lines are lagging? did you say you understood it yourself?
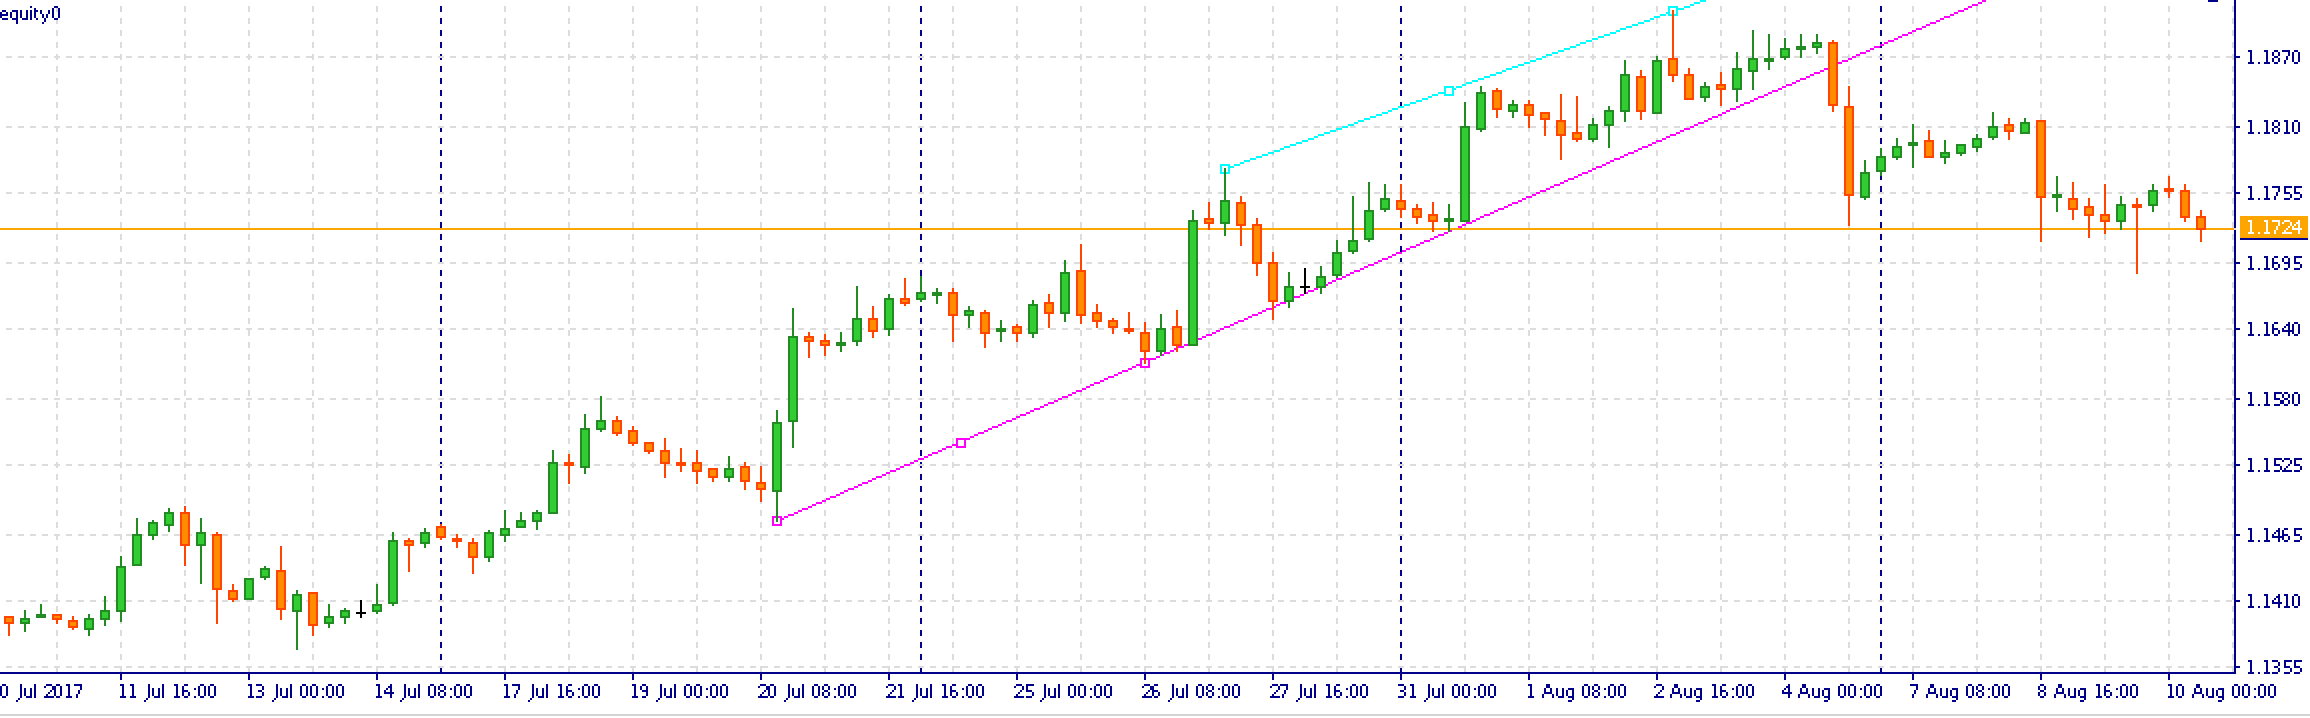
A line can only be drawn when the price has already moved away from its original position.
The pink line in the picture above appears at best on July 31. The whole main trend is missed.
All that was needed was from 10 to 14 to get into a buy on the basis that things had been going up for a few months prior to that. Put a stop at 1.13 as the level where there was a lot of stopout last time.
After that, the hardest task is to do nothing. No lines, divergence, MACD and other brainstorming.
If it gets below 1.1711, I will go short
Let me make a prediction!!!
I'll give you a prediction!!!
No, I won't!
I won't!
And what was that?))
What's with the hit-and-run?
- Free trading apps
- Over 8,000 signals for copying
- Economic news for exploring financial markets
You agree to website policy and terms of use