Not the Grail, just a regular one - Bablokos!!! - page 238
You are missing trading opportunities:
- Free trading apps
- Over 8,000 signals for copying
- Economic news for exploring financial markets
Registration
Log in
You agree to website policy and terms of use
If you do not have an account, please register
And I did a brute force one, not as pretty, but it works...
I couldn't get the joker code to work. Yours did:
The result immediately made it clear what the monster joker code does:
Let's not focus on the school algorithm of combining combinations. And let's not stress that it would look a hundred times better in OOP. Let's get straight to the point.
Why do you make yourself such an elaborate pain? Do you continue to make an enumeration of lots for each such combination? So this is not understanding the essence of the portfolio.
There is a wonderful example of lot (coefficient - right) - zero. Well, consider that you have a zero lot for some symbols. So go through them.
Definitely, with such a search can not go far - even the Cloud will not help test the TS. You have to do the maths, without brute force.
but it's still better with calculated lots than just
and in principle trend synthetics of the same scale are very similar to each other
I have statistics on trending synthetics. I took this definition: a synthetic is promising to buy if it has been trading above the AMA for half a month on the day. That is, there has been a breakout of the AMA. The volume of all synthetics shown in the file does not exceed 6.1 USD minimum lots.
Column A is the day of the year when the synthetic was identified as a prospect. Column B - weight of the synthetic in minimum USD lots. Column D - the synthetic itself. Columns K, G and F - day, day number of the year and number of synthetics identified on that day as a prospect and remaining as such as of the last date. Column I is the number of synthetics retired from the prospect list as of the last date.
It can be seen that many synthetics are kept above the AMA for months. New ones are identified on a regular basis. So, they are not all similar.
Many synthetics are highly correlated with each other. I distinguish between two types of correlation: vector correlation and trend correlation. Vector correlation is when synthetics are very close in terms of currencies. Trend is when synthetics are close in terms of movement.
Vector. Each synthetic can be contrasted with a vector whose components are calculated as the value of a currency bought (sold with a "minus" sign) in the same unit of measure. The cosine of the angle between such vectors gives the vector correlation.
I took the plan file for 18.11.14. This is how one of the synthetics looks like today. Clusters are formed by trend correlation. Strongly correlated vector synthetics are truncated: the pattern with the smallest weight is selected.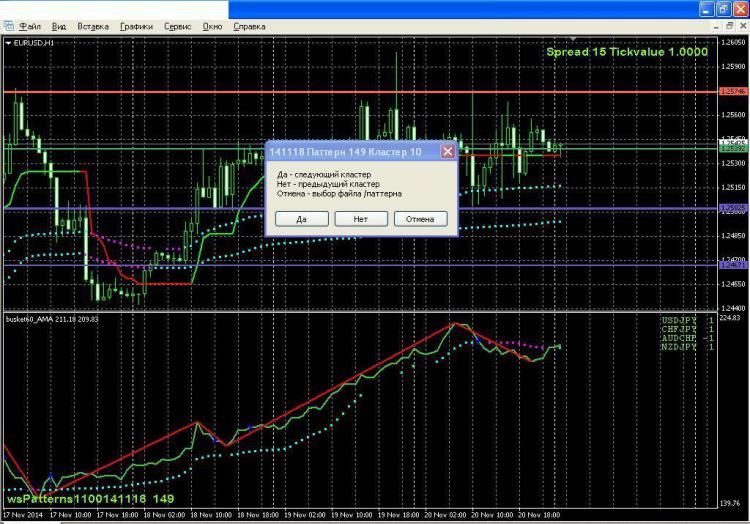
_new-rena:
Alexander used the same strategy in the following way:
He monitored the correlation of the pairs, which indicated whether they were converging or diverging. The principle - the correlation is less than 0.7 - they diverge, hence the one at the top is bought, and the one at the bottom is sold. If the correlation starts to move towards 1, then it's the other way round.
You have written some nonsense. The correlation shows the similarity in the movement of pairs. It does not show whether the pairs are converging or diverging. High correlation is cointegration, i.e. the similarity of pair movements.
A list of all the synthetics in seven pairs of four pairs. A total of 35 pieces. Hovered robot on mt5 based on Recycle2 earnings on average under 50-100% per month at 10% drawdown, but there are drops and failures in drawdown stability is not enough yet. I do not fully understand the mathematics of Recycle2 and spread chart movement in the channel.
You have written some bullshit. Correlation indicates the similarity in the movement of pairs. It does not show whether the pairs are converging or diverging in any way. High correlation is cointegration, i.e. the similarity of pair movements.
где то начиналось ещё тогда....
I know that he traded with me and Alexander, and that a lot of things that are not in that thread went through his personal account. I know how he traded, not out of the blue.
And the correlation is not constant. The price of the market is higher than the price of the real one.
Evaluating the correlation is the best way to overlap pairs.
I know how he traded, I didn't just blurt it out.
))) Do you directly know, or did he want you to know that you know how he traded?