The regularities of price movements: Part 1. Price orientation
3. Next, I decided to increase the number of bars in the triangles to 7, so I redid the script a bit:
// Скрипт для подсчёта соотношения чисел затухающих и разгорающихся треугольников //
// Skript OtnoshZatRazTreug, июнь 2012
// Примечание: скрипт может немного подвисать на ТФ M1.
#property  copyright "Copyright © Svinotavr-2000"
#property  link      "DmitriyN"
//#property show_inputs

int start()
 {
   // Декларация
   double DliPer;           // Длительность периода исследования, лет
   double n;                // Количество бар, шт
   double KolZatTre;        // Количество затухающих треугольников, шт
   double KolRazTre;        // Количество разгорающихся треугольников, шт
   double OtnoshZatRaz;     // Отношение числа затухающих треугольников к числу разгорающихся, раз
   double Pogreshnost;      // Погрешность исследования, %
   // Берём число бар на 6 меньшее, чем всего
   n=Bars-6;
        // Цикл по всем барам
        for(int j = 0; j < n; j++)
        {
               // Считаем количество ЗАТУХАЮЩИХ треугольников    ===========

               // Проверяем, являются ли High баров после начального бара (j+5)
               // _ меньше либо равными High начального бара (j+5)
               if (High[j+6] >= High[j+5]) {
               if (High[j+6] >= High[j+4]) {
               if (High[j+6] >= High[j+3]) {
               if (High[j+6] >= High[j+2]) {
               if (High[j+6] >= High[j+1]) {
               if (High[j+6] >= High[j])   {
               // Проверяем, являются ли Low баров после начального бара (j+5)
               // _ больше либо равными Low начального бара (j+5)
               if (Low[j+6] <= Low[j+5])   {
               if (Low[j+6] <= Low[j+4])   {
               if (Low[j+6] <= Low[j+3])   {
               if (Low[j+6] <= Low[j+2])   {
               if (Low[j+6] <= Low[j+1])   {
               if (Low[j+6] <= Low[j])     {
               KolZatTre=KolZatTre+1;
               }}}}}}  }}}}}}

               // Считаем количество РАЗГОРАЮЩИХСЯ треугольников ===========

               // Проверяем, являются ли High баров после начального бара (j+5)
               // _ больше либо равными High начального бара (j+5)
               if (High[j+6] <= High[j+5]) {
               if (High[j+6] <= High[j+4]) {
               if (High[j+6] <= High[j+3]) {
               if (High[j+6] <= High[j+2]) {
               if (High[j+6] <= High[j+1]) {
               if (High[j+6] <= High[j])   {
               // Проверяем, являются ли Low баров после начального бара (j+5)
               // _ меньше либо равными Low начального бара (j+5)
               if (Low[j+6] >= Low[j+5])   {
               if (Low[j+6] >= Low[j+4])   {
               if (Low[j+6] >= Low[j+3])   {
               if (Low[j+6] >= Low[j+2])   {
               if (Low[j+6] >= Low[j+1])   {
               if (Low[j+6] >= Low[j])     {
               KolRazTre=KolRazTre+1;
               }}}}}}  }}}}}}
         }
  // Вычисляем длительность периода истории исследования (календарный)
  DliPer = n*Period()/(1440*365);
  // Считаем отношение числа затухающих треугольников к разгорающимся
  OtnoshZatRaz=KolZatTre/KolRazTre;
  // Вычисляем погрешность расчётов
  Pogreshnost=(1/(KolZatTre) + 1/(KolRazTre))*100;
  // Формируем строки для печати
   string S0 = "\n" + "================= Результаты расчётов =================" + "\n" + "\n";
   string S1 = "Исследовано бар = " + DoubleToStr(n,0)+ " шт" + "\n";
   string S2 = "Длительность периода исследования = " + DoubleToStr(DliPer,1)+ " лет" + "\n";
   string S3 = "Погрешность расчётов = " + DoubleToStr(Pogreshnost,3)+ " %"+ "\n";
   string S4 = "Отношение числа затухающих треугольников к разгорающимся = " + DoubleToStr(OtnoshZatRaz,3)+ " раз"+ "\n";
   string S5 = "Число затухающих треугольников = " + DoubleToStr(KolZatTre,0)+ " шт"+ "\n";
   string S6 = "Число разгорающихся треугольников = " + DoubleToStr(KolRazTre,0)+ " шт";
  // Выводим строки на экран
   Comment(S0, S1, S2, S3, S4, S5, S6);
 }
An example of the result of the script:
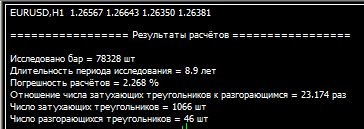
You should agree that the difference of 23.1 times with calculation accuracy of a little over 2% can hardly be called a regularity.
What conclusion can be drawn from all this? The conclusion is that the price has an orientation (direction).
It is quite possible that if the price is reversed, the results obtained by many Expert Advisors will be quite different and most probably will be in favor of traders:
If you're interested - read, think, experiment...
If you want to check this pattern on a chart with random increments being in the normal distribution - go ahead :)
If someone has a constructive criticism (constructive, not indiscriminate) or suggestions - I will be glad to listen.
of the latter - most likely what you call fading triangles and even on the watch - is just a Sessional decrease in candlestick volatility :-)
and further, you have so far - so to speak - found the reference points - but beyond them - the behaviour of bars (direction of movement) - will be about 50/50... therefore - all this has no practical value :-) (without regard to MM :-) IMHO.
If anyone has any constructive criticism (constructive, not indiscriminate) or suggestions, I would be happy to listen.
If you are looking for patterns in forex, then be decent:
If you are looking for a pattern, be decent. 1.Indicate the data from a brokerage company or compare data from different brokerage companies, as for me, the patterns of filters are of little interest.
2) Indicate not only one currency pair and TF, but better - in the table again different pairs and different TFs.
If we have such a table, we can talk about it...
;)
Corrected the errors above.
| Timeframe | Ratio, times | Accuracy, % | Period of history, years |
|---|---|---|---|
| М1 | 2,185 | 0,003 | 8,3 |
| М5 | 3,849 | 0,038 | 8,9 |
| М15 | 9,569 | 0,313 | 8,9 |
| М30 | 14,39 | 0,836 | 8,9 |
| Н1 | 23,17 | 2,268 | 8,9 |
At TF H4 the error becomes unacceptably large - not enough data.
The number of fading triangles there is 143, and the number of flaring triangles is 1 (one) per history of 9 years.
Most likely the method of calculation of accuracy and the triangles formalization algorithm will have to be revised.
Table 2: Pair - GBPUSD | demo account| Alpari quotes | 7-bar triangles
| Time frame | Ratio, times | Accuracy, % | History period, years |
|---|---|---|---|
| M1 | 2,844 | 0,004 | 8,1 |
| M5 | 4,289 | 0,041 | 8,8 |
| M15 | 7,688 | 0,243 | 8,9 |
| M30 | 10,84 | 0,642 | 8,9 |
| H1 | 17,25 | 1,793 | 8,9 |
On TF H4 the error is large - about 17.3%. The number of triangles on the 9 year histories is 161 pcs /6 pcs = 26.8 times.
Decided to move the messages to a separate thread...
1. I started with rereading Williams' book and decided to check the share of interior bars on the chart. Then I decided to compare the share of interior and exterior bars and, as a result, I detected the following pattern: the share of interior bars is higher than the share of exterior bars.
This is obvious even without any experiments.
which poplars are more "inside" or "outside"? of course "inside"!
Because the outer ones are the big ones, and the big, long poplars... ugh, bars - obviously less statistically than the small, short ones. Long candles are less frequent. Short ones more often.
A pattern? Yes.
And now pay attention to the question: And what does this give us?
the answer: a net!
enrichment recipe:
We take a small bar in the narrowing chain, and put the net to both sides, with a refill, the farther - the more refill. In whose direction the first will play in the profit - he won.
2. Then, following this logic, I decided to investigate the ratio of internal and external triangles. I called the internal triangles damped, and the external triangles flared.
A simple script was written for this purpose:
It would also be good to collect statistics on the size at points of these triangles, and very well on the time (days) of their formation.
I will assume that the fading triangles occur on the news.
- Free trading apps
- Over 8,000 signals for copying
- Economic news for exploring financial markets
You agree to website policy and terms of use
Decided to move the posts to a separate thread...
1. It all started when I was rereading Williams' book and decided to check the share of interior bars on the chart. Then I decided to compare the portion of interior and exterior bars and, as the result, I detected the following pattern: the portion of interior bars is higher than the portion of exterior bars.
Let me remind you what interior and exterior bars are:
In the screenshot above: bar B for bar A is external and bar F for bar R is internal.
A simple script was written for research in this area:
Example of the script result:
2. Then, following this logic, I decided to investigate the relationship of internal and external triangles. I called the internal triangles fading and the external triangles flaring.
For this purpose I wrote a simple script:
The above script analysed triangles of size six (6) bars. In this script a very simple way to calculate the calculation error was added.
An example of the result of the script:
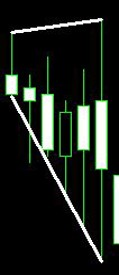
Let me remind you what fading and flaring triangles are. Example of a fading triangle (1) and a flaring triangle (2):
1).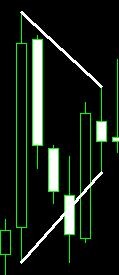 2).
2).