Has anyone wondered why and how much the trend building "walks"?

Just did an experiment - it moves out.
And if you put one end of the trendline at that date and price, and beam it, then no.
I'll continue. I don't think there's anything wrong with posting this piece of dialogue from my private message.
I try to work with Gann fan and the fibo retracement like Michael Jenkins in his book " Secret of Angle Method " where the crosses of the Gann fan with the fibo lines can be good turning points.
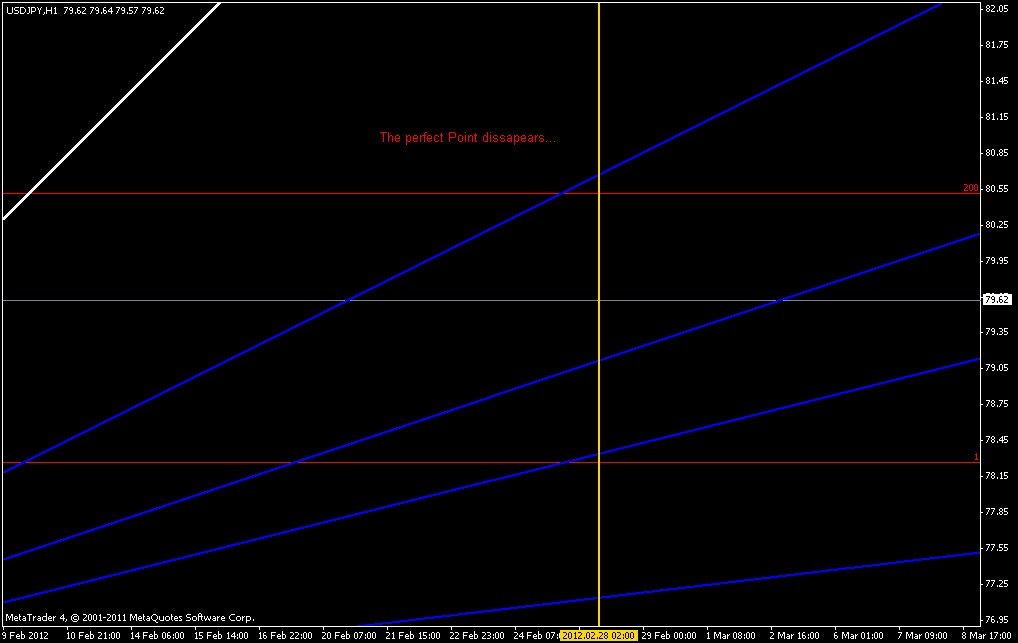
These points change when you put the zoom, ( Problems with the scale ) and I think that is caused by fibo lines and not by your Gann fan.A free translation -- the man is trying to work with a fan from the book "..." where the intersections of fibo levels and Gann lines can be good pivot points.
So these points change when you change the scale -- the screens above show it perfectly.
In terms of trading and normal trades, 5 pips is not much in principle. But it will have some effect on many deals, imho.
But if we're talking about the crossing point, the meaning changes dramatically. My screenshots show shift of 2 hours. I think it may be no less than four hours.
Honestly, there's not much to discuss. Just would like to hear a comment from the developers.
And I need to check on the 5.
TheXpert:
Loose translation -- a person is trying to work with a fan by the book "..." where the intersections of Fibo levels and Gann lines can be good pivot points.
The rough answer is that everything plotted by angle (time) cannot be compared to what is plotted by price.
A compression factor has been introduced into such tools to adjust the view.
So there's probably no error there. It's just that the scale jumps and will continue to do so as the tools are different by nature.
Alex, you're missing the point.
This is the person my script set was essentially made for. There the Gann fan is built by trendlines.
And the goal was to avoid line movements when changing scale.
But somehow the trend lines magically have movement as well.
It's the trend lines that we're talking about. You may check it. I will not waste my breath.
sergeev:
так как инструменты по природе разные.
No, because the fan has a well-defined ratio of tangents, the construction is unambiguous and should not float in any way.
The TF spread is due to the fact that a high TF candle consists of several candles of a low TF.
Max (min) on the lower candle may be on 1,2... n candle.
The built-in MT4 trend lines cannot find the necessary candle (see figure above, it was built on H4. Since M30 it starts to hang in air)
Nen made ATL (Adaptive Trend Lines) they do everything right (see picture below).
How to work with the indicator: install it on the chart. Go to properties - addlines - put true, a line appears, go to properties - and false (so that no new lines appear)
Drag and drop our trend line where necessary

In short, there is a whole set of features
Check it out here http://www.onix-trade.net/forum/index.php?showtopic=82128
and here http://www.onix-trade.net/forum/index.php?showtopic=81546&st=0
Alex, you didn't get the whole point.
This is the person my script set was essentially made for. There the Gann fan is built by the trend lines.
And the goal was precisely to avoid line movement when you change the scale.
I see.
I just tried it. Drawing trend/vertical/horizontal lines. With a common crossover point.
Then changed scale and price scale. The crossover point is still there.
I must be doing it wrong...
My crossing point only changes when switching between timeframes.
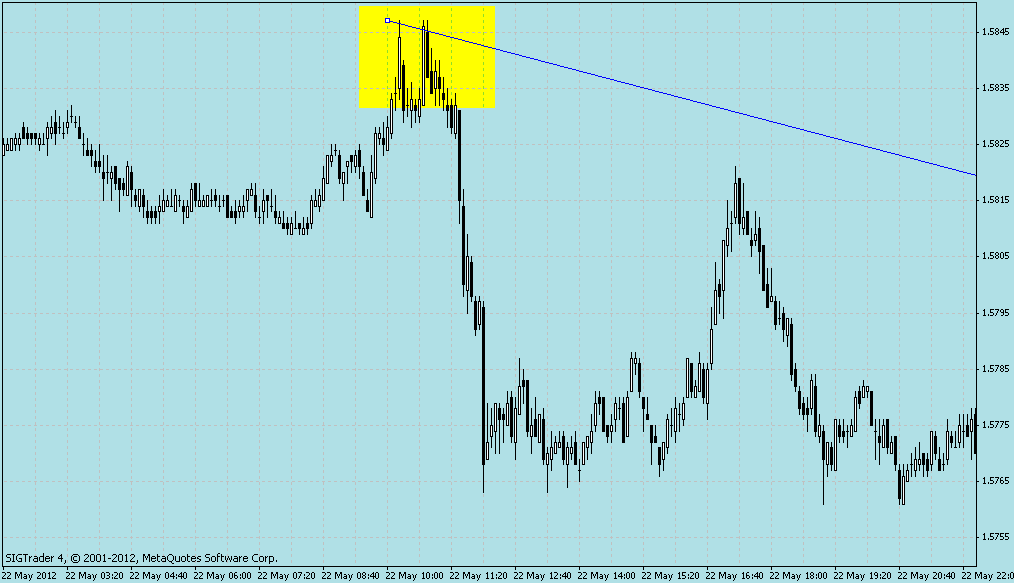
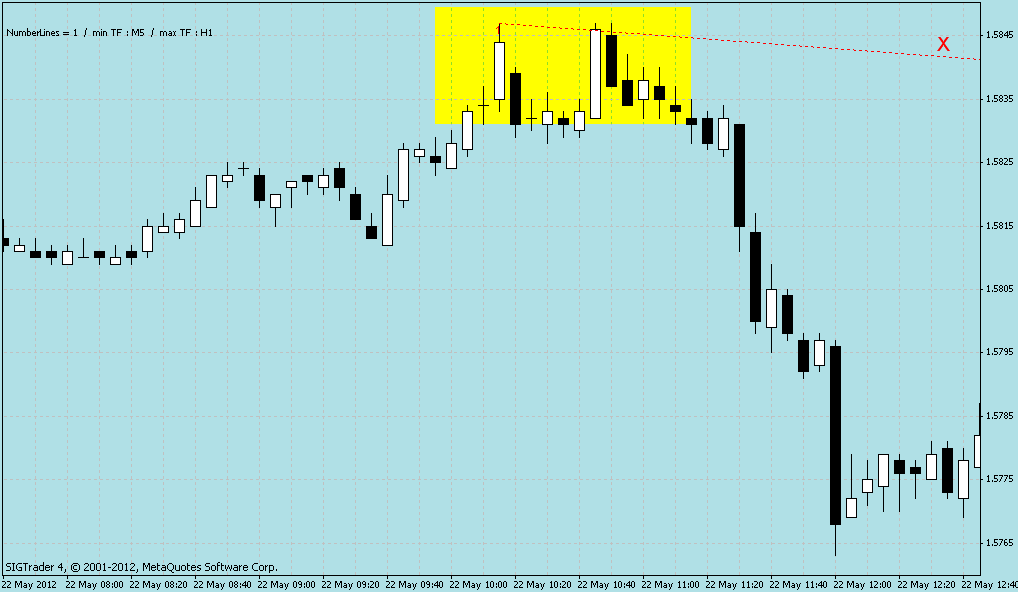
As you can see from the image, by at least a few points.
There is no history paging, shifting or other nonsense. The images are obtained simply by scrolling.
I thought at first it was just inaccuracy of construction (+- pixel or something like that), but on the middle highlighted fragment the line is on opposite sides of the opening price.
Holes in the history of 1-2 minutes or whatever is in a day (during history swapping, which happens during TF changes, there may be a shift).
The points of the lines are drawn at the opening candle time, i.e. if you build it on H1, and then change the TF (to a smaller one), then naturally the line will shift.
I've been working on this for a long time and I'm still working on it.)
ZZZY: in this case it is likely to be inaccurate when you change the vertical scale
- Free trading apps
- Over 8,000 signals for copying
- Economic news for exploring financial markets
You agree to website policy and terms of use
As you can see from the image, by at least a few points.
There is no history paging, shifting or other nonsense. The pictures are simply obtained by scrolling.
At first I thought it was just inaccuracy of plotting (+- pixel or something), but on the middle highlighted fragment the line is on different sides of the opening price.