What is the question? Or is it advice?
LeoV:
What is the question? Or is it advice?
More like advice. I have scoured the web and found no discussion of this method, and the idea itself was found only in one place, and even then it was mentioned in passing and forgotten about. And the inputs are so early that I decided to create a topic - they clearly deserve attention.
What is the question? Or is it advice?
Mendikero:
How do you choose the parameters for these indicators?
wmlab:
The inputs are not impressive even on the illustration alone. Write an EA to check it out.
The inputs are not impressive even on the illustration alone. Write an EA to check it out.
If it were one indicator, it would be easy to make one based on exp_iCustom_v10, but there are two indicators and I cannot make an Expert Advisor out of this double.
P. S.: Special thanks to you for the wmifor indicator.
DmitriyN:
Small and constant indicator period + minute timeframe = enough for me to draw not so good conclusions.
I don't know why r772ra chose the minute chart to illustrate it - I gave an example on the four hour chart.
Small and constant indicator period + minute timeframe = enough for me to draw not so good conclusions.
jelizavettka:
How do you choose the parameters for these indicators?
I don't - I use them as they are.
How do you choose the parameters for these indicators?
You are missing trading opportunities:
- Free trading apps
- Over 8,000 signals for copying
- Economic news for exploring financial markets
Registration
Log in
You agree to website policy and terms of use
If you do not have an account, please register


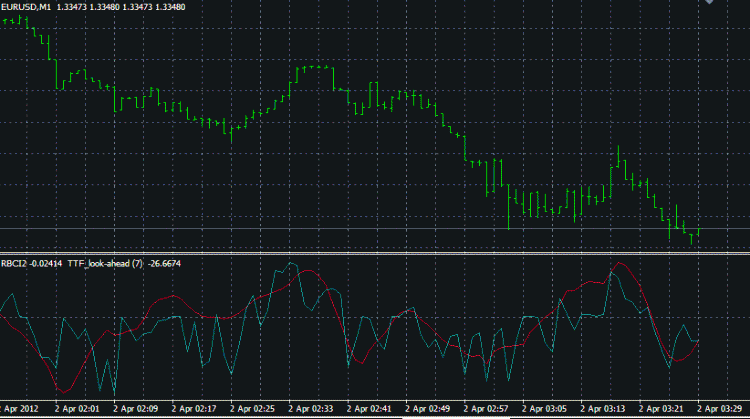
There are a couple of well-known indicators - RBCI (https://www.mql5.com/ru/code/7205) and TTF (https://www.mql5.com/ru/code/7377). They are not very effective by themselves and do not differ much from other indicators. But if we put them on top of each other, we get something rubbish - the pair shows entry and exit points a few candles before the start or end of the trend! And often after the signal the price moves in the opposite direction for some more candles, and then anyway goes in the direction indicated by the intersection of the pair! There are false signals, but they are more than compensated by profitable ones! If the red line is above the blue one, it is a signal to Sell, if it is vice versa, it is a signal to Buy.
Here is the hourly chart of EURUSD on which I marked non-transforming signals (on a closed candle) and marked entry points with arrows (entry immediately after the close of the candle marked with an arrow):