Econometrics: one step ahead forecast
Using the KotirOut indicator attached to article #2, I sample on D1
DATE,kotir.
2011.08.01 00:00,1.4361
2011.08.02 00:00,1.4254
2011.08.03 00:00,1.4188
2011.08.04 00:00,1.4361
2011.08.05 00:00,1.4092
2011.08.08 00:00,1.4368
2011.08.09 00:00,1.4164
2011.08.10 00:00,1.4392
2011.08.11 00:00,1.4161
2011.08.12 00:00,1.4238
.
.
.
11.11.01 00:00,1.3842
2011.11.02 00:00,1.3662
2011.11.03 00:00,1.3725
2011.11.04 00:00,1.3824
2011.11.06 00:00,1.3828
2011.11.07 00:00,1.3816
2011.11.08 00:00,1.3766
2011.11.09 00:00,1.383
There are 76 observations in total. The last date is the current date. We will get the forecast for tomorrow, November 10.
Regression equation:
Estimation Equation:
=========================
KOTIR = C(1)*HP1(-1) + C(2)*HP1_D(-1) + C(3)*HP1_D(-2)
Substituted Coefficients:
=========================
KOTIR = 0.999499248852*HP1(-1) - 0.0151635132798*HP1_D(-1) - 0.176713388909*HP1_D(-2)
We run the program MOD2_T in EViews and get the result:
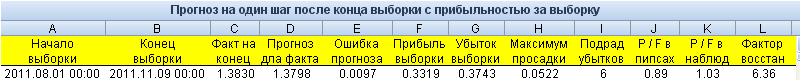
So: tomorrow's forecast from 00:00 hp 1.3798
But there is a number of significant flaws: the forecast error is 97 pips. A sample run gave bad results: Profit Factor = 0.89
The result is disgusting and we have to look for the reasons.
Let's look at the regression estimation results:
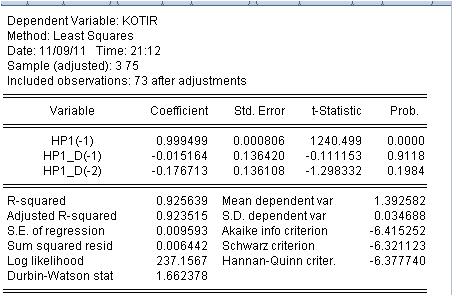
Well. It didn't take much digging. The probability of the last two coefficients being equal to zero is very high, i.e. we cannot reject the hypothesis that the last two coefficients are equal to zero.
This regression equation is no good and it needs to be changed. It is based on the Hedrick-Prescott indicator, by the way. There is no point in discussing the profitability of this model.
I am waiting for suggestions.
I think we need to find out the minimum required argument of f(x) first. It may turn out that only the prices of the current timeframe are not enough. We can try another approach, let's rewrite your equation f(x)=a*X1+b*X2+c*X3.... Now we will use genetics to find the maximum by optimizing the coefficients a,b,c.
It seems to me your approach is not very good. Try to take the explicit flat part of the chart. It seems that the price in this area is close to a normally distributed random variable.
faa1947:
Итак первый прогноз.
It is based on the Hedrick-Prescott indicator, by the way. There is no point in discussing the profitability of this model.
I'm waiting for a suggestion.
You strangely have no way of dismissing this X-P... even though it's pointless.... you're holding on to this H-P like you're hypnotized.... and it's been going on for quite some time now...
Here's a suggestion: If the next model doesn't work, toss it in the trash -- without pity or regret. Consider other options -- it will give you a chance to see the similarities and differences, the subtle nuances.
I know from experience, and I can tell you that in the future you may come back to some previously discarded models -- but from a new perspective.
What is the essence of the TS from article 2? Is it predicted that price returns to the smoothed value?
Extrapolated smoothed + noise
I think we need to find out the minimum required argument of f(x) first. It may turn out that only the prices of the current timeframe are not enough. We can try another approach, let's rewrite your equation f(x)=a*X1+b*X2+c*X3.... Now we will use genetics to find the maximum by optimizing the coefficients a,b,c.
It seems to me that your approach is not very good. Try to take the explicit flat part of the chart. It seems that the price on this part is close to a normally distributed random variable I do not believe it is possible to write the equation for the next heads or tails.
First of all it is necessary to find the necessary minimum of arguments f(x). It may turn out that only the prices of the current timeframe are not enough.
In my terms: Variables are missing. It should be investigated if there are missing variables. I will do it below.
It seems to me that your approach is not very good. Try to take a section of the chart of an obvious flat
The idea is different: any section. Fit a regression and then predict for the next candle. A new candle comes, we adjust again (shift the window) and again forecast the next candle, etc.
Have you lost your mind? Have you read the news? (only making fun of people). Buy! (3650 max)
You strangely have no way of giving up on this X-P... even though it makes no sense.... you hold on to this H-P like you're hypnotized.... and it's been going on for a long time...
Hodrikt has nothing to do with it.
The model we use has an idea: isolate the deterministic component and add noise to it
There are other ideas. What about you? Is there gas in the flat? Or do you have ideas, please, and I'll show you the calculations.
The result of the previous forecast.
Forecast was for a short - have a short - forecast successful!
- Free trading apps
- Over 8,000 signals for copying
- Economic news for exploring financial markets
You agree to website policy and terms of use
Article #2 with a similar title has been published. This article is a continuation of the other article #1. These articles are a brief overview of econometrics.
Using these articles I propose the following to forum members: to work collectively on creating econometric models for predicting the quotes of currency pairs one step ahead. The size of one step corresponds to the timeframe, to which the Expert Advisor described in article #2 is attached.
I will take the model presented in article 2 and make two forecasts: on H1 and D1. We will see the result. Then, I hope the collective will suggest improvements to this model or their own models. I will take someone else's models and make a forecast and post the result. I'm ready to answer questions and comment on posts as I go along.
The model is an arbitrary function (regression) of the form y = f(x1, x2, .... xn). Function y is, for example, the EURUSD pair or any other currency pair. xi are the function arguments (independent variables, regressors) - any other quotes available in the terminal. For example, record:
EURUSD EURUSD(-1) GBRUSD(-1)
means that we calculate the value of EURUSD for two other currency pairs, and we take the previous values of these pairs in relation to the function (EURUSD dependent variable). It is obvious that we can build a model on one currency pair, on its lag values - this is a classical TA approach, and we can build multicurrency models - in contrast to TA there is no difference in terms of complexity. But we will see in all its glory what correlation is and its value in trading.
Files in MQL4 and EViews are attached to this article.