Zero sample correlation does not necessarily mean there is no linear relationship - page 31
You are missing trading opportunities:
- Free trading apps
- Over 8,000 signals for copying
- Economic news for exploring financial markets
Registration
Log in
You agree to website policy and terms of use
If you do not have an account, please register
Unfortunately, all the Internet resources(1, 2) don't have a good analysis of such a simple thing as correlation.
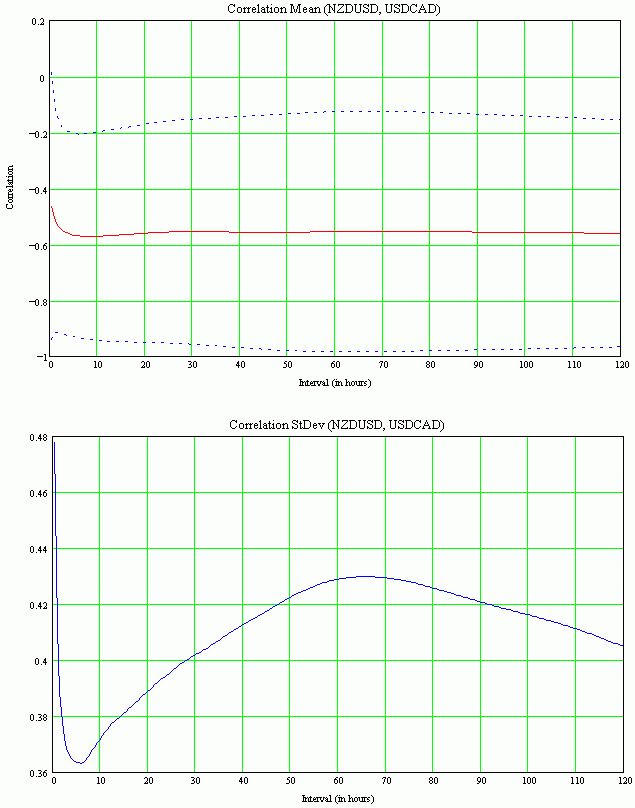
Here is an example of a graph of KK change (correlation coefficient) for NZDUSD and USDCAD for different window sizes (on each 100,000 KK stop frame (counted as less than a second in MQL4)):
Charts of change in QC mat expectations with confidence interval (RMS):
>I agree, it sounds rather pathetic. However, all the tools are lying open to do the correlation analysis yourself. And on internet resources, indeed, everything is in a very primitive form. And this is most likely due not to laziness of resource developers, but to ignorance of quick QC calculation. An indirect proof of this is the absence of correlation indicators on any platform in the world.
Why they cannot write them is a mystery.
You can do some pretty interesting research quickly. Good for you! Another example, this time not taken out of the blue, but the supposedly highly correlated majors NZDUSD and AUDUSD:
High correlation confirmed. The most highly correlated interval is exactly one day (24 hours). I think this is a coincidence.
>Now an example of the allegedly highly correlated (according to one internet resource) EURJPY and USDJPY:
Correlation is not high at all. The most highly correlated interval is 2-2.5 hours.
>Finally, a result that will be of interest to those involved in pair trading. A correlation study for the Stoxx and CAC indices:
Correlation is hyper-high. The most highly correlated interval is 28-29 hours. I think this is not a coincidence (the session lasts 14 hours).
>