Recognising images ( rhetorical theme )
I don't quite understand, are we talking about recognising candlestick patterns?
It seems to me that recognising the obvious shapes isn't hard to do. Another thing is those areas where a man is scratching in the back of his head :D :D
I could be wrong, though. I will have to try it.
PS. there is a program autrochartist, I did it once, out of interest, I randomly tapped the last signals - well, everything is correct.
the candles are essentially a kind of digitised image compressed in time with 4 parameters
It's not about candlesticks.
remove the candlesticks or bars from the chart, leave only the price line
How easy it would be to recognize even an obvious shape.
you need to recognize it in real time and not on history
--
Shit, that was a mistake. I was referring to technical analysis figures, not candlesticks of course.
Why are you talking about "5 or 6 different indicators"? Are you suggesting we should identify the shapes by indicators?
My thesis is: it is easier to recognize shapes than to distinguish a dog from a cat (though it is not so easy). It is clear what we are guided by - support/resistance levels drawn through the local maximums and minimums.
the candlestick is essentially a digitized image compressed in time with 4 parameters
No, not the candlesticks.
remove the candlesticks or bars from the chart leave only the price line
how easy it would be to spot even an obvious pattern
and it has to be recognized in real time, not in history.
--
Yura... I'm new to programming, MKL is the only language I know a little bit at beginner level, and believe me, I've tried all the graphical shapes, triangles, vertices, head-shoulders and many other patterns already
I even described the diverters, though I thought it would not work with my knowledge of the language.
I describe candlesticks and bars with 3 parameters.
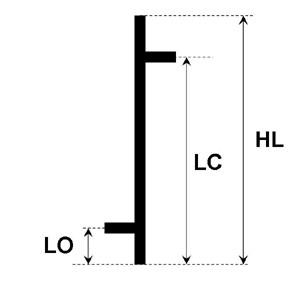
The parameter HL is absolute and expressed in pips. The other parameters - LC and LO - are relative and expressed as fractions of HL, HL is taken as a unit. A complex number is obtained, e.g:
K= (HL, LO/HL, LC/HL);
or
K= (360, 0.128, 0.746);
Thus any bar is described by a complex number and is easier to analyse.
Pattern recognition programs are complex and cannot be written "in an hour". This work is expensive. But, if the complex task is broken down into several smaller ones, it is doable. The only question is what the "price" will be for this recognition. Most likely it will turn out to be somewhere between 55/45 to 45/55.
By the way, Yuri, have you ever tried to build bars on the zig-zag?
Shit, that was a mistake. I was referring to technical analysis figures, not candlesticks of course.
Why are you talking about "5 or 6 different indicators"? Are you suggesting we should identify the shapes by indicators?
My thesis is: it is easier to recognize shapes than to distinguish a dog from a cat (though it is not so easy). It is clear what we start from - support/resistance levels drawn through the local maximums and minimums.
No I don't ... that's what the customers want.
--
it's hard enough to recognize an image ... although there is experience of mankind in this direction
I describe candlesticks and bars with 3 parameters.
The parameter HL is absolute and expressed in pips. The other parameters - LC and LO - are relative and expressed as fractions of HL, HL is taken as a unit. A complex number is obtained, e.g:
K= (HL, LO/HL, LC/HL);
or
K= (360, 0.128, 0.746);
Thus any bar is described by a complex number and is easier to analyse.
Pattern recognition programs are complex and cannot be written "in an hour". This work is expensive. But, if the complex task is broken down into several smaller ones, it is doable. The only question is what the "price" will be for this recognition. Most likely it will turn out to be somewhere between 55/45 to 45/55.
By the way, Yuri, have you ever tried to build bars on the zig-zag?
No, we're not talking about bars...
it's about the pattern... which makes the price...
--
Totally agree!
That's right.
--
... distinguish a cat from a dog ...
Yuri, I don't get it backwards... what do you mean "customers want"? They want to recognise shapes on the price line, but necessarily with indicators? (then the question is - do they care as long as it is recognised correctly). Or do they want to recognize figures on the indicator lines? Or do they want to look for divergences?
Pattern recognition programmes are complex and cannot be written in an "hour". This work is expensive.
- Free trading apps
- Over 8,000 signals for copying
- Economic news for exploring financial markets
You agree to website policy and terms of use
Good afternoon!
Since I write to order, interesting letters come in...
I will not give you examples from the letters... I'm just summarizing my experience of communicating over a fairly long period
the gist is about the following:
When a double top is formed, "sell" - "buy", depending on which top is a bull or a bear.
--
It's an interesting topic in itself, of course any image can be digitized
then by averaging the image... for example to distinguish whether a cat or a dog is depicted :-)
( I remember reading somewhere - a computer cannot trade unless it can distinguish a cat from a dog)
When I say to a surprised customer that a program that can tell the difference between a dog and a cat will cost a lot of money
The correspondence on the terms of reference usually stops...