Indicators: Ergodic Mean Deviation Index Oscillator Ergodic_MDI
IMHO it would be good to replace the histogram with a line to better see the intersections.
And maybe even mark these intersections with icons (disable sound would also be nice), because the values of lines are quite close (often even almost co-directional at intersection) and at small scale "merge" - often without using the data window it is difficult to compare them and easy to miss.
IMHO this levelling out the advantages of Ergodic-a, and MDI itself is good.
PS: perhaps a better option would be to colour the histogram values in a different colour when it is smaller than the main MDI line (abs). Especially important for people with vision problems. And just comfort of use.
IMHO it would be good to replace the histogram with a line to better see the intersections.
The histogram was chosen deliberately to better see the intersections - see the picture with the histogram.
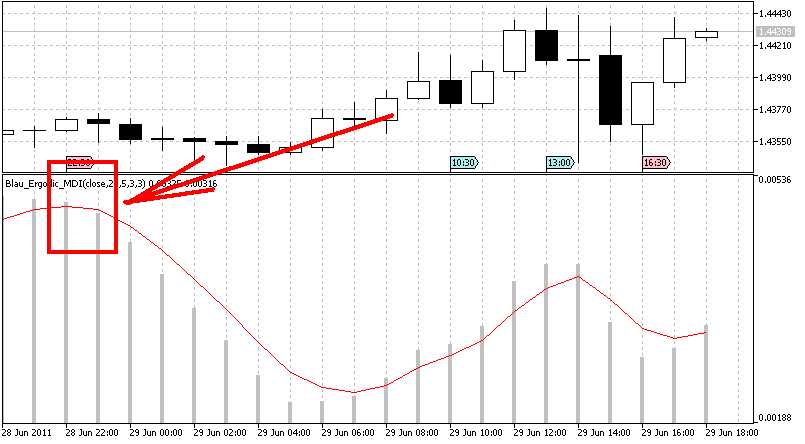
and without

My opinion is that since price bars are discrete, not continuous, the diagram shows (or confirms) the crossover more clearly.
However, "to taste and colour" - the article https://www.mql5.com/en/articles/190 explains in detail enough for a beginner how to build an indicator.
Any attentive beginner reading the article can change the histogram to a line by himself according to the description in the article (at least I want to believe it and I strived for a clear educational presentation).
Besides, the diagram was chosen for educational purposes - to show that there are other types of drawing besides lines.
The article was written primarily for beginners
.
PS: perhaps a better option would be to colour the histogram values in a different colour when it is smaller than the MDI main line (abs). This is especially important for people with vision problems. And just comfort of use.
multicoloured indicators - I put THIRD item - SECOND - second part of the article - I plan to submit it for checking for publication in the nearest week - in the 2nd part will be presented Blau trading systems based on indicators from the 1st part (experts, analysis of their efficiency and additional filters for Blau indicators).
without additional Blau filters - indicators from the 1st part have a number of significant drawbacks - but this will be discussed in the 2nd part.
- Free trading apps
- Over 8,000 signals for copying
- Economic news for exploring financial markets
You agree to website policy and terms of use
Ergodic Mean Deviation Index Oscillator Ergodic_MDI:
Ergodic MDI-Oscillator by William Blau is based on Mean Deviation Index (see Momentum, Direction, and Divergence: Applying the Latest Momentum Indicators for Technical Analysis).
Author: Andrey N. Bolkonsky