Channel, what are you?
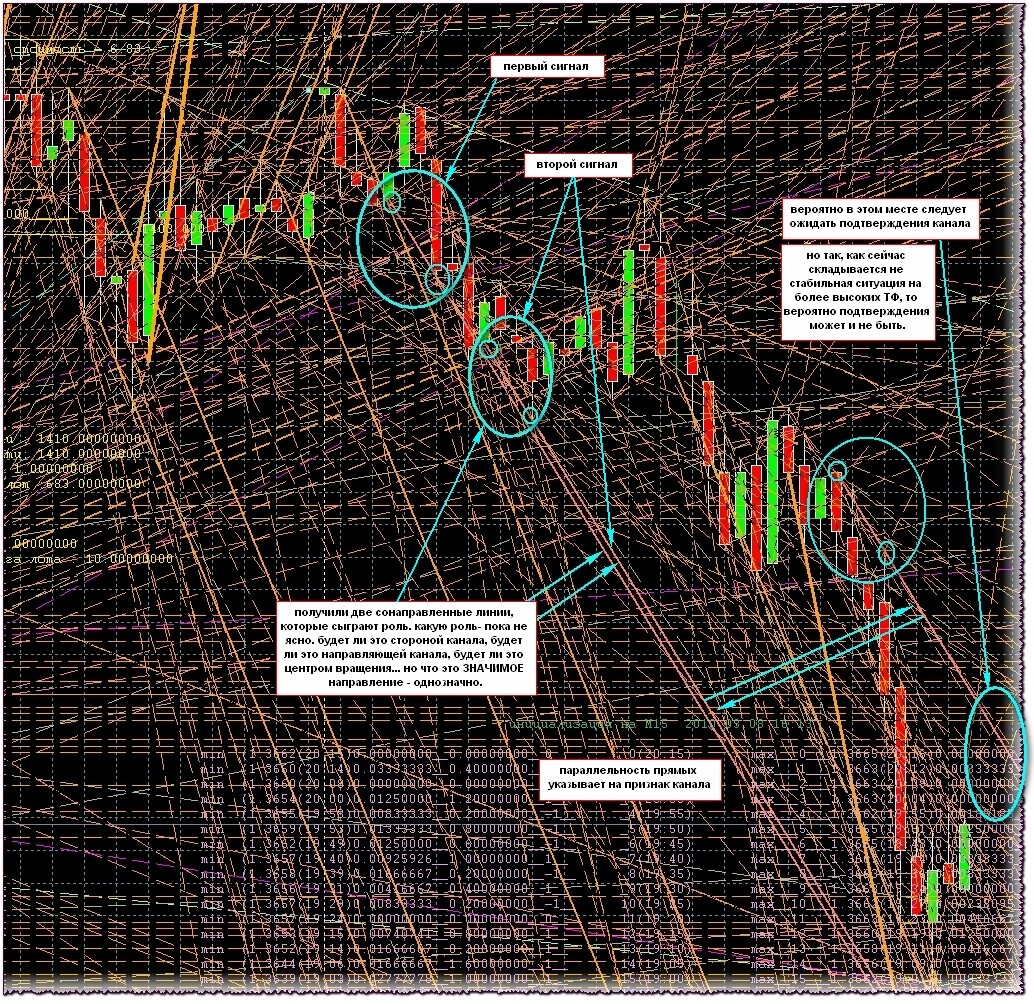
Here is, say, an indicator that automatically builds areas with narrow channels.
Indicator from ANG3110
Picture only

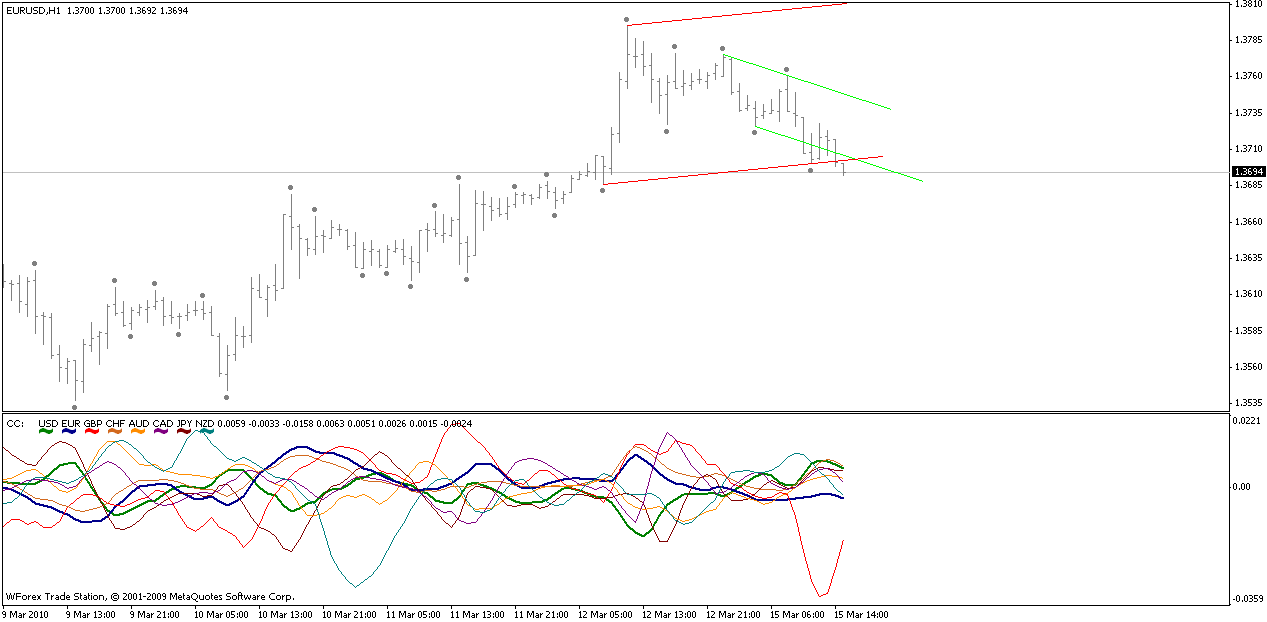
And this is the same, but on M15

I like to use two channels: ascending and descending (the names are a bit wrong, but that's not the point))). The rising channel is constructed as follows: we draw the TD-line of supply (according to Demark), then we find the minimum between the two TD-points and draw a line parallel to the first (in the screenshot it is light green). The downwards line is drawn in the opposite way: the TD-line of demand, find the maximum between the points and draw a parallel line (red in the screenshot). Using the Complex_Common indicator (by Semen Semenych) I identify the trend. If the trend is going upwards, then I use
and breakdowns from channel borders and breakdowns of TD lines for buying, if the trend is going down - the same thing, only for selling. Basically, I get the same Barishpolts' moving channel but with double:)))
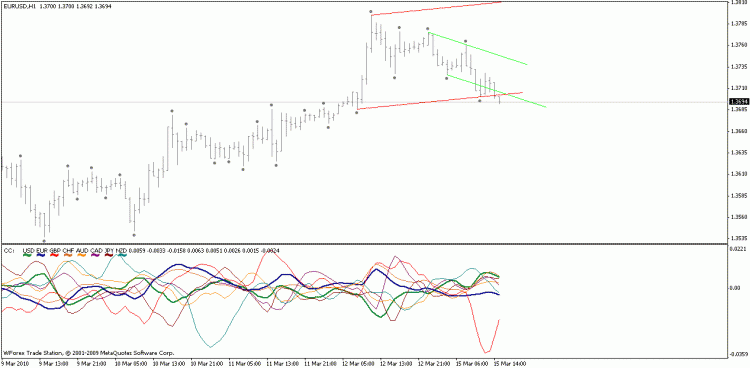
PS. The points on the chart are fractals:)
and breakdowns from channel borders and breakdowns of TD lines for buying, if the trend is going down - the same thing, only for selling. Basically, I get the same Barishpolts' moving channel but with double:)))
PS. The points on the chart are fractals:)
the concept of "channel" is tightly linked to the concept of "support-resistance"... to paraphrase the topic, it is necessary to look for SAR lines. on the other hand, the channel itself can be represented as a "wide" SAR line.
alsu писал(а) >>
I suggest we discuss the following question.
We all know what a price channel is, of course, and we can easily identify it visually. But how do we formalise this process? Does anyone have thoughts about what the criterion of "channeling" of a certain interval of history is?
Obviously, a simple solution like "the last thirty bars show price in a certain range" is not satisfactory - this is too rude method, it will produce a lot of "false positives".
I would like to consider both horizontal and ascending/descending channels and still understand how our wonderful brain determines the presence of the channel in a given price movement.
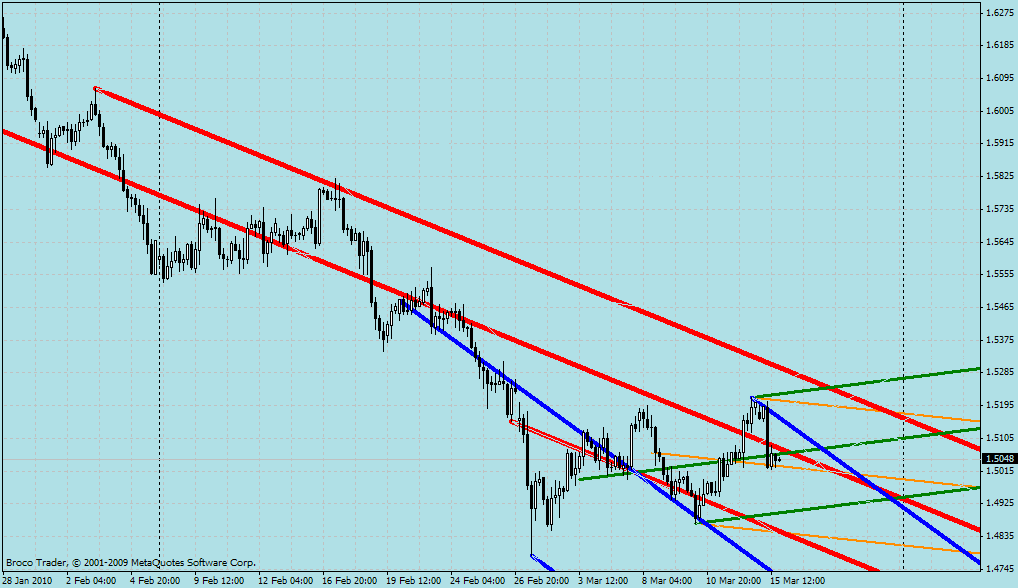
Gliding Channels
two people will draw each one differently.
So will different algorithms.
I use the MNC approximation +/- 3s.
So will different algorithms.
I use the MNC approximation +/- 3s.
alsu >>:
Хотелось бы взять в рассмотрение как горизонтальные, так и восходящие-нисходящие каналы и понять все-таки, каким же образом наш замечательный моск определяет наличие канала в данном движении цены.
Хотелось бы взять в рассмотрение как горизонтальные, так и восходящие-нисходящие каналы и понять все-таки, каким же образом наш замечательный моск определяет наличие канала в данном движении цены.
I think our brain recognises patterns.
The channel can, in principle, be built using three points, e.g. the tops of the ZZ, but to build a ZZ like our ... uh... brain, not so easy, I think :)
Temporary forks
You are missing trading opportunities:
- Free trading apps
- Over 8,000 signals for copying
- Economic news for exploring financial markets
Registration
Log in
You agree to website policy and terms of use
If you do not have an account, please register
We all know what a price channel is, of course, and we can easily identify it visually. But how do we formalise this process? Does anyone have any ideas about what is the criterion of "channeling" of a certain period of history?
Obviously, a simple solution like "the last thirty bars show price in a certain range" is not satisfactory - this is too rude method, it will produce a lot of "false positives".
I would like to consider both horizontal and ascending/descending channels and still understand how our wonderful brain determines the presence of the channel in a given price movement.