You are missing trading opportunities:
- Free trading apps
- Over 8,000 signals for copying
- Economic news for exploring financial markets
Registration
Log in
You agree to website policy and terms of use
If you do not have an account, please register
I guess everyone has an opinion :)
Your picture

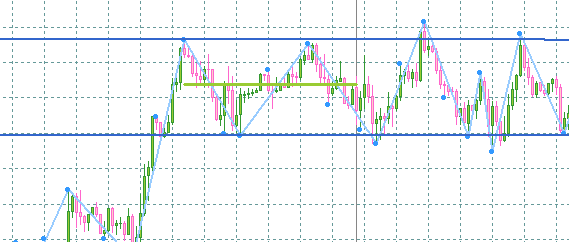
Eh, there can't be any channels at all on that graph :) It's an M1. It displays the random price fluctuations, associated with fluctuations in the volume of transactions. A channel should be formed by support and resistance levels. So they can be seen only on higher timeframes IMHO.
And what's left and right "IS NOT A CHANNEL" is quite normal (if you look at it purely technically).
I think everyone has an opinion :)
Your picture
Don't get muddy, it's an H1! )))
The point is the same on all timeframes...
Trading in channels
The rules for trading in channels are based on the fact that the borders are strong lines.
The consolidation area, which has been hit by several trends, is like a funnel-ridden battlefield.
Its defenders have plenty of cover, and attackers will likely have to slow down.
The longer prices halt in a consolidation area, the stronger the emotional commitment of bulls and bears to that area.
When prices approach it from above, it serves as support. When prices approach it from below, it acts as resistance. The role of a consolidation area can vary and it can be either support or resistance.
The strength of each support or resistance area is determined by three factors: its length, height and the volume of trades that have been made in it. These factors can be thought of as the length, width and depth of the consolidation zone.
The longer the consolidation zone, in time or in terms of the number of touches it has sustained, the stronger it is. Support and resistance, like good wine, get better with age.
In two weeks of trading, the nearest support and resistance form, in two months people get used to them and support or resistance becomes of medium strength, and in two years an actual standard forms, providing very strong support and resistance.
As support and resistance levels age, they weaken. Losers leave the market and are replaced by newcomers who have no emotional connection to the old price levels. Those who have just lost money remember very well what happened to them.
They are probably still in the market, with their pain or regret, and are seeking to rectify the situation. Those who made bad decisions a few years ago are probably already out of the market and their feelings mean less.
The strength of support and resistance increases every time prices reach that level. When players see prices turning around at a certain level, they will expect them to turn around the next time too.
The larger the range of prices in the resistance and support area, the stronger it is. A consolidation with a large break price range is like a high fence around valuable property.
A consolidation area equal to 1 per cent of the current price level gives only slight support or resistance.
A price area equal to 3 per cent gives average support or resistance, and a price area equal to 7 per cent or more can stop a very strong trend.
The higher the volume of trades in a support or resistance area, the stronger it is. High volume in a consolidation area shows the involvement of many players and indicates strong emotions.
Low volume indicates that players don't care about crossing that level and is a sign of weak support or resistance.
Copy from here
The rules for trading in channels are based on the fact that the borders are strong lines.
...
A key phrase in my opinion. But how do you determine this strength? - If we look at history, we can judge the strength of channel borders based on the number of price bounces from these borders. But if we have, say, a ZigZag which shows that the last two highs and lows form parallel segments (i.e. ZZ has 4 extrema at the channel boundaries)... Will there be a channel next?
Maybe there's a chance of catching the channel even earlier?