Criterion for automatic selection of optimisation results. - page 9
You are missing trading opportunities:
- Free trading apps
- Over 8,000 signals for copying
- Economic news for exploring financial markets
Registration
Log in
You agree to website policy and terms of use
If you do not have an account, please register
(PF-1)*SdDay - limits from above so that this coefficient does not capture the bulk of the Vigoda indicator. The more trades, the more difficult it is to achieve high profitability.
(PF-1) - it is used to make the PF multiplier negative in case of a negative balance. It goes as the first indicator, on this reason the following ones should also influence the volume of total, and not to have some own preponderance.
((PipBar+Ust)/10) - time is not in our favor when opening a position, as the market may change at any minute, and the PipBar indicator (now it's changed to PipMin, point/minute) shows the quality of the time used, i.e. maximum amount of points in minimum time. Ust is also important, the higher the value, the smoother the growth of balance. Dividing by 10 equalizes the effect on the overall balance.
(ProcDay*10)/(MD+(SrD*4)) - The ratio of the balance growth rate to the used risks during it. Multiplying by 10 and 4, also to equalise the impact on the total.
If you use multiplication instead of addition, it is more difficult to balance the impact of each indicator, which sometimes causes the total to jump unnecessarily. Believe me it's already been tested, if one parameter is slightly overestimated, when multiplied it often pulls the total to the wrong top.
I keep adjusting the formula and will post updates and comparisons later...
(PF-1)*SdDay - ограничения сверху для того, чтоб этот коэффициент не захватил основной объем показателя Vigoda. - 1. Указывает на явное использование неверной зависимости от Профит Фактора. Чем больше сделок, тем сложнее добиться большой прибыльности. - 2. Cформулируем по-другому, тем сложнее добится случайного результата с большой прибыльностью.
(PF-1) - делается для того, чтоб при отрицательном показателе баланса, множитель PF тоже был отрицательным. - 3. Отрицательный баланс имеет минус, а профит фактор < 1 - это имеет смысл и методически оправдано. Смысл перегружать одно другим? Это идет как первый показатель, по этому следующие должны также влиять на объем общего, и не иметь какой-то свой перевес. -
((PipBar+Ust)/10) - при открытии позиции время не в нашу пользу, т.к. рынок может поменяться в любую минуту, и показатель PipBar (теперь я его переделал на PipMin, пункт/мин.) как раз и показывает качество используемого времени, т.е. максимальное кол-во пунктов за минимальное время. - 4. Обратная зависимость критерия от длины тестируемого периода проще и понятнее. Ust - устойчивость также не мало важна, чем выше показатель, тем значит плавнее рост баланса. - 5. Прибыль деленая на максимальную просадку никак не вяжется с плавностью роста баланса. Я бы так не называл это. Деление на 10 выравнивает влияние на общую сумму. - 6. Эта 10-ка результат каких-то статистических формульных вычислений или среднепотолочная эмпирика по типу "подогнать примерно"?
(ProcDay*10)/(MD+(SrD*4)) - соотношение скорости роста баланса к использованным рискам во время этого. 4. Обратная зависимость критерия от длины тестируемого периода проще и понятнее. Умножения на 10 и 4, также для выравнивания влияния на общий показатель. - 6. Эти 10-ка и 4-ка результат каких-то статистических формульных вычислений или среднепотолочная эмпирика по типу "подогнать примерно"?
Если использовать вместо сложения умножение, то сложнее отбалансировать влияние каждого показателя, от этого итог иногда неоправданно скачет.Поверьте уже все проверено, если один параметр слегка завышен, то при умножении он часто вытягивает общий итог не на ту верхушку. - 1. Указывает на явное использование неверной зависимости от Профит Фактора, Профита, Максимальной просадки, Длины тестируемого периода.
Я продолжаю корректировать формулу и позже выложу обновления и сравнения...
Let me show you with a simple example, and you will realise that your approach is methodologically incorrect.
The balance sheet figure is valuable to us because we compare it to our dream of "more money". Balance and "more money" are of the same nature, and the bigger the balance, the closer it is to "more money".
The maximum drawdown indicator is valuable to us because we compare it with our nightmare - "lost deposit". Maximum drawdown and "lost deposit" again are of the same nature and the lower the drawdown is, the further we are from "lost deposit".
Profit factor is valuable to us, because we compare in it the sum of all profits with the sum of all losses. Surprisingly, the sum of all profits and the sum of all losses are the same nature again, and the more profits and less losses we have, the more valuable the indicator is to us.
I think that you have understood the importance of comparing (adding, dividing and multiplying) homogeneous indicators, indicators of the same nature. Otherwise it will be a mess.
Now let's return to your SrD. Using his example, I want to point out to you that introducing an indicator just because we know how to count the average drawdown on all trades is as pertinent as the average temperature of the patient. Can you explain what SrD adds to the valuation? In my opinion - absolutely nothing. Drawdowns of 1,11,1,11,1,11,... would be equivalent to a drawdown of 6,6,6,6,6,6,6,... for your SrD. I don't think you will find any supporters here who would agree with that estimate. Especially if the death of the deposit comes at a drawdown of 10. Do you understand the value of maximal drawdown? It indicates how close to death your deposit was and whether it is alive or dead at the finish. SrD itself does not indicate anything, because you do not compare it with an indicator of the same nature, but simply hang it in the air without estimation, so it has no value. If you really want to enter something like that, try to calculate SrProfit and compare it to SrD, but not to MD and certainly not to the rate of balance growth.
Once you have the indicators they should be multiplied. If one indicator is more important to you than another, you should use a more "powerful" function for it. For example, square the weightier indicator, or take the logarithm from the less weighty one, square root, etc. etc. It is a matter of taste and preference to impose weight on an indicator using a function. There's no statistics behind such a multiplication, it's just a rough approximation that makes sense - the proportionality of the criterion to the indicators that are important to you. But what you are doing - dividing profits by bars and adding growth rate divided by different drawdowns, trying to normalise by eye with 10s and 4s - it would be true if there was a strict mathematical formula behind your calculation. So far your formula is not even a rough approximation as it has no indicators.
Vita писал(а) >>
Now back to your SrD. Using his example, I want to point out to you that introducing an indicator just because we know how to count the average drawdown on all trades is as pertinent as the average patient temperature. Can you explain what SrD adds to the valuation? In my opinion - absolutely nothing. Drawdowns of 1,11,1,11,1,11,... would be equivalent to a drawdown of 6,6,6,6,6,6,6,... for your SrD. I don't think you'll find supporters here who would agree with that estimate. Especially if the death of the deposit comes at a drawdown of 10. Do you understand the value of maximal drawdown? It indicates how close to death your deposit was and whether it is alive or dead at the finish. SrD itself does not indicate anything, because you do not compare it with an indicator of the same nature, but simply hang it in the air without estimation, so it has no value. If you really want to enter something like that, try to calculate SrProfit and compare it with SrD, but not with MD and certainly not with the rate of balance growth.
MD is one of the most important indicators. And our task is to reveal the honesty of this indicator. What does it mean? Let me explain by example: suppose we have two similar passes, both have the same drawdown and everything else is close to each other, initially there is no fundamental difference. In fact, in one of the passes the drawdown is adjusted against dangerous deals (which have not opened and we do not see them), while in the other pass the drawdown is mostly small and only in one random deal it has reached the same level. As a result, we obtain radically different two passes. If we imagine that drawdown of each trade is a hatching, SrD just defines density and radius of this hatching, and it shows evidently that the maximal drawdown for example of 15% has coincidentally hardly reached statistical 25-30% (which are not opened within millimeters from the signal and we can't see them) or vice versa slipped from 5-10% (maximal open all positions).
PF is also one of the most important indicators. And its optimization can be easily carried out leaving out dangerous deals within a millimeter. To my mind, it is better to open all deals and obtain PF 1.8. But it is better to see all dangerous and safe deals and in fact (after optimization) narrow the signal a bit and obtain PF 2-3. In optimization the life for the TS must be tough, while in fact it is possible to facilitate the work. All the more so because losing trades are no longer needed here... "Hard in learning - easy in battle" as they say, that's how it should be...
PipBar - I am explaining the importance with an example. Again, the two passes are similar to each other, and the number of deals is the same. Only in one pass the deals open on the average, wait half a day, then close well. In the other one they open, in 5-10 minutes a bounce occurs and they are closing in the plus. The same profit is obtained but with cardinally different time use. Although their testing period is the same (a year for example). PipBar transparently shows the quality of time used, i.e. TS takes money from the balance for a minimum period with maximum return!
I will write about the rest later...
MD - один из самых важных показателей. И наша задача выявить честность этого показателя. Что это значит? Объясняю на примере: предположим у нас два похожих друг на друга прохода, у обоих одинаковая просадка, и все остальное так же где-то рядом, изначально нет принципиальной разницы. На самом деле в одном из проходов просадка подогнана в притирку от опасных сделок (которые не открылись, и мы их не видим) - прошу пояснить, что такое опасная сделка, которая не открылась и котрую мы не видим, и как её на чистую воду выводит SrD? - а в другом наоборот просадка в основном маленькая, и только в одной случайной сделке она дошла до такого же уровня - уровня опасной сделки, так ведь?. В итоге мы получаем в корне разные два прохода. Если представить что просадка каждой сделки это штриховка, то SrD как раз и определяет плотность и радиус этой штриховки, и наглядно показывает что максимальная просадка к примеру 15% случайно совпала еле вытягиваясь из статистических 25-30% (которые не открылись в миллиметре от сигнала, и мы их не видим) или наоборот случайно проскользнувшая из 5-10% (максимально открытых всех позиций). - Я приводил примеры просадок 1-11-1-11-... против 6-6-6-6-... Я полагаю, что для них SrD одинаковое, но вот первый пример как раз именно тот, который дергает эти ваши опасные сделки, или не так?
PF - также один из самых важных показателей. И оптимизация его может получить запросто, также обходя опасные сделки в миллиметре. По мне так лучше открывать все сделки и получить PF 1.8. Но чтоб видеть все опасные и безопасные сделки, - у вас есть определение опасных и безопасных сделок и когда они открываются? Выше вы их связываете с просадкой. Сложно понять, что это. а уж на деле (после оптимизации), немного сузить сигнал и получить PF 2-3. В оптимизации жизнь для ТС должна быть жесткой, а на деле можно и облегчить труд. Тем более что убыточные сделки здесь уже не нужны... "Тяжело в учении - легко в бою" как говориться, вот так должно быть... - Интуитивно, я понимаю, чего вы желаете добиться. Сомневаюсь, что для оптимизации вы ставите параметр PF=1.8 и он вам делает прогон с PF=1.8, а для работы вы устанавливаете PF=2-3. Нет, конечно, оптимизационные и рабочие варианты отличаются другими параметрами. И вам кажется, что при оптимизационном режиме вы собираете "опасные и безопасные" сделки, убеждаетесь, что все тип-топ, а потом как бы выключаете "опасные" сделки и в уме держите - класс, я осведомлен об "опасных" сделках, я их контролирую, ведь, я их выключил в рабочем варианте, и если они даже возникнут, то они мне не угроза. Это иллюзия. Мне она напоминает анекдот про "Что делаю? Отгоняю крокодилов - Так их отродясь тут не было - Так это потому, что я их так хорошо отгоняю. А по-научному, любое высказывание о любом элементе пустого множества верно. Все что вы не придумаете о сделках, которых не было, которые не открылись в рабочем варианте и в любом другом, - все будет верно. Ваше "лучше открывать все сделки" показывает вам реальность при одном наборе оптимизируемых параметров. "Немного сузить сигнал" - другую реальность, в которой нет сделок из первой. Эти несуществующие сделки, которые не открылись при узком сигнале, существуют только в вашем воображении. И естественно, вы осведомлены о них, что они "существуют", что все под контролем - вы их отпугнули "сузив сигнал". Попробуйте понять, что в условиях "узкого сигнала" неоткрывшихся сделок нет, их свойств мы не знаем, но воображать о них мы можем что угодно. Интуитивно хочется приоткрыть дверь и вглянуть на эти неоткрывшиеся опасные сделки, но приоткрывая дверь - расширяя сигнал, мы меняем реальность. Я бы не тратил время на попытку взвешивания фантомов. Исходите из фактов. Для каждого прогона они свои.
PipBar - объясняю важность на примере. Опять же два похожих друг на друга прохода, да же кол-во сделок одинаково. Только в одном проходе сделки в среднем открываются, пол дня межуются, потом закрываются хорошо. В другом открываются, через 5-10минут происходит скачок, и закрываются также в плюсе. Получается одна и та же прибыль, но при кардинально разном использовании времени. Хотя период тестирования у них одинаковый (год к примеру). PipBar - прозрачно показывает качество использованного времени, т.е. ТС занимает деньги у баланса для совершения сделки на минимальный срок с максимальной отдачей! - Желание понятно, но методологический подход неверен. Расчитайте стоимость денег, которую вы одолжили у депозита на сделку(и) и сравните её с чем-то такой же природы, т.е. снова стоимостью чего вам покажется правильным. Или умножьте обратную величину стоимости на критерий - чем больше стоимость, тем хуже. Так ведь? А вы её к устойчивости прибавляете. То, что вы делаете, это попытка вымучать калибровкой коэффициентов критерий по вот такому типу: максимальная скорость/стоимость авто + количество подушек безопасности / расход топлива на 100 км + мощность /% по кредиту
Об остальном позже напишу...
The first question we want to answer when optimising with a constant lot is what level of drawdown we should expect from the TS. Suppose the drawdown level is 30% of the initial deposit. How to implement this criterion in practice, so that we could eliminate unnecessary variants during optimization? For example, like this:
After optimization we obtain a sample of variants that we transfer to Excel. Sorted by the criterion - recovery factor (profit/maximum drawdown).
The second question is, which variant to use in the real trading? Suppose the best variant gives a drawdown of 10%. We allow for 3 times the drawdown, i.e. the volume of transactions can be increased by 3 times. But ... Further parameters of the chosen variant can worsen. As a rule, this happens.
Then instead of one variant, we can use simultaneously a group of variants with the volume equal to one lot (0.01, 0.1, 1, etc.). At the same time, we put a limit on the number of trades opened at the same time. For example, we set 20 Expert Advisors to trade and only 3 positions with a single volume can be opened. We set a check before opening a position:
Thus, we redistribute the probability of getting a potential drawdown of 30% of initial deposit by 20 Expert Advisors instead of one.
Now the problem is to choose these 20 Expert Advisors? Simply taking the 20 best options is not a good solution. After all many variants have the same amount of deals during optimization period, i.e. they operate synchronously. So we sort by number of trades and by recovery factor. In each group we choose the best variant.
For me,the "criterion for automatic selection of optimisation results." is time, i.e. the system must be stable at all time intervals.
The market is dynamic, so we can conclude that the optimization outputs are dynamic and cannot be used for automatic selection.
If the APS detects a high volatility of the market and enters the intraday mode, then what to do with auto-selection?
Suppose the second half of 2008 (01.08.2008-01.01.2009) optimization does not make sense, ATS with one MA will be profitable.
Sampling of trending and non-trending timeframes is an option (I prefer the fixed two-week optimization).
How to achieve stability?
My selection criterion is stability. Try to change my approach, I do it like this:
Half year, 12 independent optimizations, on M5 are enough.
Usually there will be no more than 50 parameter variants left, which will, however, give us about 2-3 "same" configuration packages.
Selection of optimization results by pf or cc is directly related to methodology of ATC algorithm writing.
A person needs time to learn how to walk, a boxer first needs more than one tournament to qualify...
There is an article which will help in sorting the data and running the selected variants of parameters on any time intervals.
>> Greetings all!
The topic of the thread and other questions on the use of optimisation results are certainly extremely important for any trader.
My question is not only addressed to the authors quoted below....
The analysis received is probably only by hand, as someone here said: "the most perfect neural network is the head".
But I think the results, both psychological and factual, are worth it.
Without false modesty), I will note that I have achieved some success in selecting the result optimization by hand. However, there is no way to automate this process. Perhaps it is just poorly formalizable experience.
It's a test version for now, but I'm already pleased with the results...
There you go, begged my super-simple but super-efficient criterion ;)
Why theme fell silent. The question in the air and so hung up. After I've tried a lot of "dumb" (one-pass) profitable EAs and then losing them on demo, if not on forwards, then on real trading, I realized that until I decide this question for myself - I will not go further.... there's nowhere to go :)
..............
If I see that it is worthwhile, I group sets - 2, a force of three and the final optimization across the interval...... choose the best, and then demo.... No guarantees, no statistics yet :)
...............................................
This post dated 04.10.2008 12:05 AM Stats should already appear!!!
Judging by the posts, everyone is more or less satisfied with their criteria and the results of the Final Set of Parameters (FSP) selection.
.............................
So here's the question:
Suppose we have a TS that is optimized on 3 weeks of history, then we select a TPF based on optimization results, then one week for real (or OOS), during the week the TPF does not change, at the end of the week we fix the result.
We repeat 52 cycles (weeks) with a shift of one week forward, i.e. 1 year.
We consider success if the result of one week trading (testing) is positive or equal to zero.
Question: What is the number of successes obtained using your criteria and methods of selecting the final set of parameters?
I am asking this question as I was searching for methods of selecting a TPF based on the optimization results.
I will describe my experience on this topic later.
Greetings all!
Okay, well, while you're all hiding, I have time to tell my story.
.............
I realized that a) the market is volatile, b) it's impossible to create an Expert Advisor that makes profit with constant parameters for a long time, c) ... other important insights,
the task was set: to learn to select among optimization results of an Expert Advisor such a Final Parameter Set (FPS), the use of which statistically reliably gives a positive expected payoff.
Everything seems to be clear, but just in case I will explain by an example from the previous post:
Thus we repeat 52 cycles (weeks), shifting one week ahead, i.e. 1 year.
Success is considered if the result of weekly trading (testing) is positive or equal to zero.
i.e. if out of 52 weeks the results of 40 weeks turned out to be successful and average loss of 12 unsuccessful weeks was, for example, 1126 c.u,
and the average profitable week turned out to be equal to - 1777 c.u., then we consider that the problem is solved perfectly.
(We understand that it is better to have the results of the sample of 520 weeks or 5200. But we have reason to believe that in samples of this size the proportions of our results do not change.)
.........
Admit that the task is a serious one. It is better than finding the grail, because theoretically any MTS can be used according to the given methodology. The topic-starter also writes about it.
The technical part was resolved as follows:
- we attach calculation of various criteria to the Expert Advisor. Standard ones from MT report plus e.g. maximum profit, time of reaching it as a % of the test time, extended Z-score, average time of a transaction for both buy and sell, time of being in buy and sell as a % of the test time, etc., etc. In short, the more the better. There is no superfluous information. (I mean information about my trades ;-)) )
- IsBackTestingTime.mqh Copyright © 2008, Nikolay Kositsin. It is remade in my version but the idea is similar. I will use the previous example: Suppose the Expert Advisor has two optimized parameters with ten values each, and one with three values. Having set the required duration of optimization and testing periods as well as shifts of these periods, for one complete (without GA) optimization we will get 31200 = 300*52 + 300*52 passes, i.e. 52 passes of 300 passes at the optimization period and 300 passes at the testing period (relative to previous passes). Kositsin's article and pictures there
I will be gone for a while, then I will continue....
In the meantime come out of hiding, stop hiding.... ))
- we write all external parameters of the Expert Advisor and criteria we need into a csv file (from deinit).
- After optimisation is complete, I load it into Excel, and in a minute we have a formatted and ready-to-use xls file with all the passes.
A question arises: what should I do with all this "stuff"?
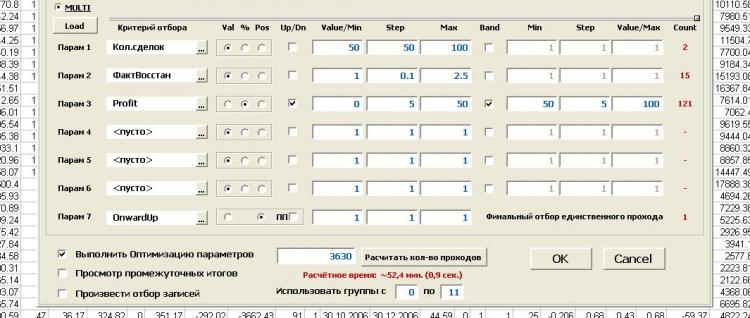
I've decided to automate the process of choosing FPP according to models that have already been described in this and other sections. For example:
Let's take 1-st subgroup optimization passes from 1-st to 300-th
1. Deals less than 50 - filter out (220 left)
2. ProfitFactor less than 2 - filter out (78 left)
3. Profit less than 30% or more than 70% (we take the middle) - filter it out (there are 33 left)
.... A total of 6 criteria can be processed with filters defined by absolute value, relative value (%) and position number. There are two types of filters - band (inside, outside) and boundary (more, less)
7. We select the FPN directly. For instance, it will be the set that has the maximum value of the criterion responsible for straightness of the balance curve.
Now let's find the corresponding pass in the test three hundred passes of this group (as if it were OoS) and fix the profit by the available number of one pass.
And so for each subgroup.
As the result we obtain the report with balance graph and indices of weekly (in this case) "trades". Everything seems glamorous. But...
Result:
No consistent patterns in the selection methods I have been able to detect. Everything seems to be fine, but something is not right. I don't believe it!!! (as the great one said...).
At the same time I believe that this approach has potential and it is huge.
I dealt with this question not for a long time, and tested only one strategy (I'm trying to remember where and why I went after developing this theme....)
Questions:
1. What do you think: Can not every TS is suitable for such treatment? i.e. more stable in time, and what to introduce a criterion for this stability, to immediately determine - our TS / not our TS.
2. What is done wrong here? May someone see other approaches?
3. I would like to hear about your results. The question is already asked in my first post(s) on this page
Proposal:
Collectively choose one ready strategy (already debugged by MTS or from credible author, suggest) and again collectively try to solve the problem (or at least come close to solving it)
using described by me functional (but I don't insist, another similar one is possible - suggest it).
Test results will be posted here or not here, we can decide together.
We can open a new thread, as you say.
Only if the results were obtained and the theme is not fading and evolving.
An addition.
1. the tool is quite flexible. It allows you to formalize any methods of selecting optimization results. Imho, of course.
2. Didn't say at all that there is functionality for optimizing methods of finding the final set of parameters, i.e. like optimizing optimization parameters. We select range and step for each criterion, as well as border type and filter operation mode, and run optimization. It is better to see once than...
That's all there is to it.
PS. "What a mess, come to think of it... No laughing matter... "(c) UmaTurman