You are missing trading opportunities:
- Free trading apps
- Over 8,000 signals for copying
- Economic news for exploring financial markets
Registration
Log in
You agree to website policy and terms of use
If you do not have an account, please register
OK. Here is the data.We seem to have misunderstood each other. My sentiments about abnormality do not apply to the generator, but to the market. Construct a distribution of first increments and see for yourself.
Well, for the spherical horse in a vacuum, ie for a guaranteed normal distribution - yes, it's unlikely. Well, the real ones aren't horses in a vacuum. There's 5 or 6 s.c.e. and even 10.
Uncle, please, here's another picture now of the pound from 1971, the diaries. There may be a single lunge (and there isn't one by the way :), the most important thing is that it doesn't become a pattern. Right?

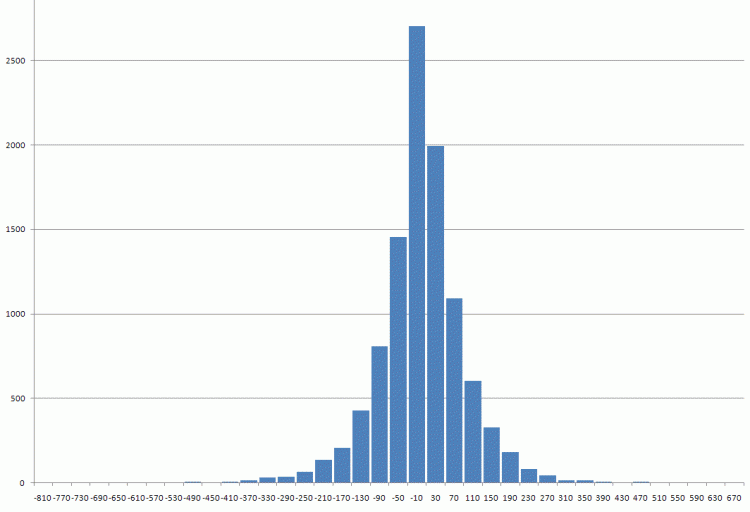
Data for checking is enclosed.First pound differences since 1971.
>>S. Maybe he should be checked for stationarity :)
Uncle, please, here's another picture now of the pound from 1971, the diaries. There may be a single lunge (and there isn't one by the way :), the most important thing is that it doesn't become a pattern. Right?
The data for the check is attached.The first differences in the pound since 1971
I would call it a Laplace distribution by eye.
I would call it the Laplace distribution by eye
The key is that there are no 5-6-10 sigmas. Otherwise, yes, but you have to test it. And yet it might be OK.Ilya, here's a suggestion: approximate this distribution by a normal distribution. And then see how different the real histogram and approximation of Gaussian curve are from each other. Don't limit yourself to three sigmas, look up at least ten.
Another trivial check: calculate the first moments of this distribution and compare them with the moments of the normal distribution.
The phenomenon of fat tails in financial series has long been known. What do you want to prove to me?
Ilya, here's a suggestion: approximate this distribution by a normal distribution. And then see how different the real histogram and approximation of Gaussian curve are from each other. Don't limit yourself to three sigmas, look up at least ten.
Another trivial check: calculate the first moments of this distribution and compare them with the moments of the normal distribution.
The phenomenon of fat tails in financial series has long been known. What do you want to prove to me?
The talk was about 5-6-10 RMS. I don't see a pattern to their appearance.
The key is that there are no 5-6-10 sigmas. As it is, yes, but it needs to be tested. And yet it might be normal.is highly unlikely. Normal distributions are usually found in nature where a "large" random variable is the sum of a large number of "small" random variables distributed in a certain way (but identically). A prime example is Brownian motion, to which so many pages have already been devoted in the next thread. In the case of the market, the law of price formation is far from it, because in order to get a normal one, a very large number of external "disturbances" are needed - which must be the main factor in the formation of the distribution. But we don't think that pricing in the market is noise, do we?
On a chart, purely visually, and you won't see that 5-6-10.
Somewhere I even had a chart showing the differences. If you take the first two moments of the distribution and think of them as moments of approximating normal, the difference in frequencies by 3, 4, 5, etc. sigmas is easy to calculate.
I do not remember the exact figures, but the real 3 sigma deviation frequency is 3-4 times higher than the Gaussian one (Gaussian 0.3%, real more than 1%). The 4 sigma deviation occurs in reality more often than the Gaussian one by about 15 times. For 5 sigma the difference is dozens of times, if not hundreds. And so on.
As long as you don't assess the risks, you don't care if it's Gaussian or not.
P.S. By the way, it seems that according to Taleb, LTCM collapsed precisely because of underestimation of risks. A deviation of 10 sigmas was considered negligible rare event. And that is exactly what happened.
I do not remember the exact figures, but the real 3 sigma deviation frequency is 3-4 times the Gaussian one (Gaussian 0.3%, real more than 1%). The 4 sigma deviation occurs in reality more often than the Gaussian one by about 15 times. For 5 sigmas the difference is dozens of times. And so on.
...which once again is evidence in favour of Laplace.
As long as you don't assess the risks, you don't care if it's Gaussian or not.
Can you please tell me how to approach risk assessment?