Discussion of article "Mathematics in trading: Sharpe and Sortino ratios"
Do they match, but not always? What is the reason for the differences?
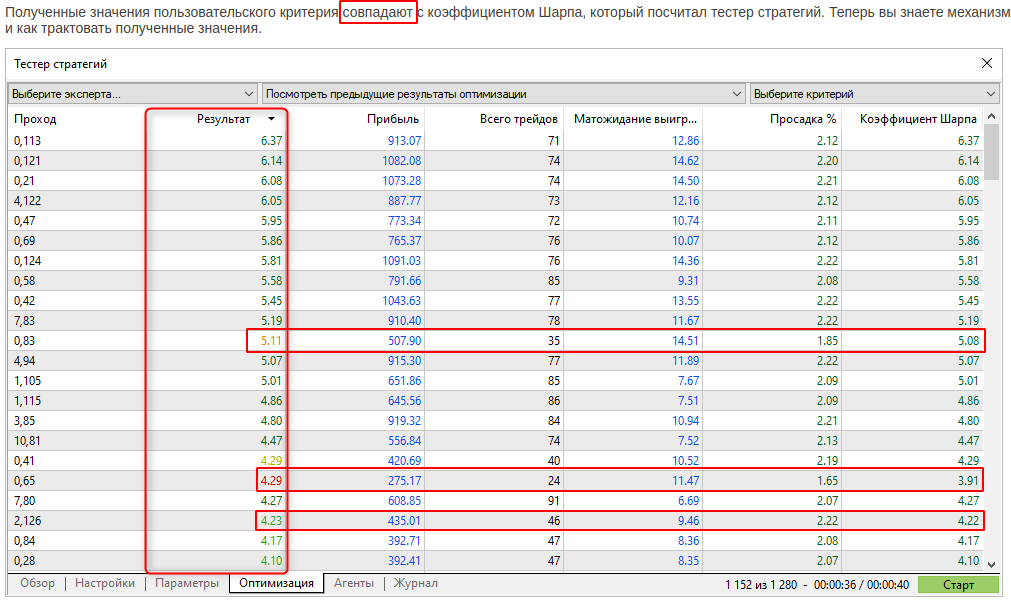
We added a penalty for a small number of trades in a pass. This allowed us to ensure convergence of results in genetic optimisation.
If the penalty is not applied, then in some cases genetic optimisation will tend to select parameters with a very small number of trades, but with a large Sharpe ratio.
We added a penalty for a small number of trades in a pass. This allowed us to ensure convergence of results during genetic optimisation.
If the penalty is not applied, then in some cases genetic optimisation will tend to select parameters with a very small number of trades, but with a large Sharpe ratio.
Isn't this the objective of the Comprehensive Criterion?
If I calculate something myself, I expect to see "clean" numbers there, without automatic penalties (by the way, I myself can "penalise" my criterion by the number of trades).
Reconsider this question, please.
Again, what is a "small number"? As for me, 70-80 is not enough, but you don't have a penalty for such passes.
Is the number of trades compared to other passes?
Is it normalised by the length of the testing interval?
New article Mathematics in trading: Sharpe and Sortino ratios has been published:
Author: MetaQuotes
Try to checl it yourself.
See also sample in internet. For example - https://www.educba.com/sortino-ratio/

- www.educba.com
The use of zero for Risk Free is not how it should be used.
As a minimum Risk Free is the return you would get from your capital if you placed it on deposit, bought treasuries etc. ie: a risk free return for the capital. not stating a current value for this artificially increases the sharpe ratio
Due to the questions about the sharp ratio of signals that are quite successful but have a Sharp Ration of less than 1 I took one:
Expected Payoff: 54.58 USD,
Profit Factor: 3.27,
Monthly growth:28.80%,
Annual Forecast:349.40%)
=> but a sharp ratio of: Sharpe Ratio: 0.27
So I took the script of this article and modified it a bit so that it reads the trade history of a signal and calculates two kind of sharp ratios.
But instead of using timespans (year, month, day..) to calculate the returns for average and standard deviation I uses the single trades or positions.
I calculate two different returns:
- one is just the profit divided by the closing volume to get a result per one lot and
- the other one calculates (close-open)/open similar to the script that calculates with open and close of the bars of day and hour.
The functions for average and standard deviation were not changed only the part that reads the file of trade history (saved in the Common folder) and function that fills the arrays with the results are amended:
For the above mentioned signal I get this:
Avg of Profit/Vol: 23.9115
StdDev: 88.985
Sharpe_annual(Prof/vol): 8.48
Shart Ration of (Close-Open)/Open:
Avg of Cl-Op/Op: 14.5605
StdDev: 79.645
Sharpe_annual(Cl-Op/Op): 5.77
That looks better than the official figures.
Attached is the script. Just select a signal, save its trading history in the common folder and start the script.
What I did not do was that the arrays of the results should be reduced by the number of entries that are zero as these are used to calculate average and standard deviation!
This thought came to me only this morning.

- 2022.10.13
- www.mql5.com
- Free trading apps
- Over 8,000 signals for copying
- Economic news for exploring financial markets
You agree to website policy and terms of use
New article Mathematics in trading: Sharpe and Sortino ratios has been published:
Return on investments is the most obvious indicator which investors and novice traders use for the analysis of trading efficiency. Professional traders use more reliable tools to analyze strategies, such as Sharpe and Sortino ratios, among others.
The diagram clearly shows that the values of the annual Sharpe ratio change every month. It depends on how EURUSD was changing this month. On the other hand, the annual Sharpe ratio for each month on all timeframes almost does not change.
Thus, the annual Sharpe Ratio can be calculated on any timeframe, while the resulting value also depends on the number of bars on which returns were obtained. It means that this calculation algorithm can be used in testing, optimization and monitoring in real time. The only prerequisite is to have a large enough array of returns.
Author: MetaQuotes