Is divergence of technical indicator believable?
Forum on trading, automated trading systems and testing trading strategies
Market Condition Evaluation based on standard indicators in Metatrader 5
newdigital, 2013.02.12 16:44
I promissed here to describe something about divergence. yes, it is related to this thread Market Condition Evaluation based on standard indicators in Metatrader 5
We can write about divergence from the following sources:
Forum on trading, automated trading systems and testing trading strategies
Market Condition Evaluation based on standard indicators in Metatrader 5
newdigital, 2013.02.12 16:45
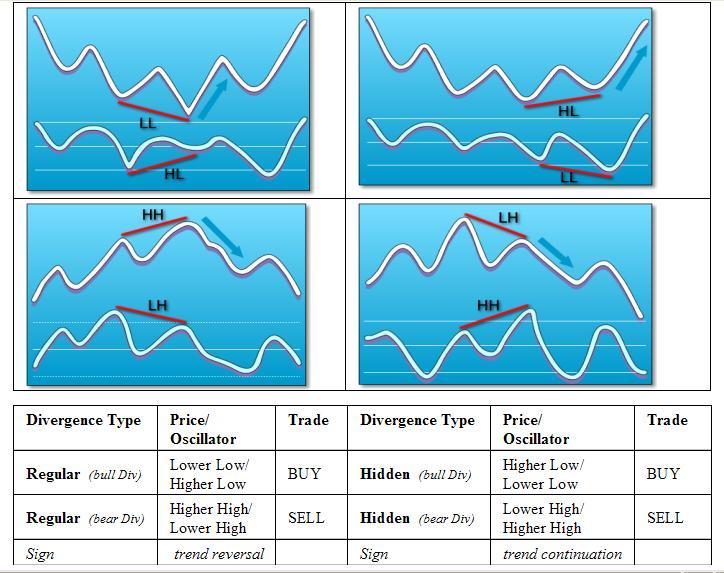
Or ... to make it shorter - we can see the rules from the image:
Forum on trading, automated trading systems and testing trading strategies
Market Condition Evaluation based on standard indicators in Metatrader 5
newdigital, 2013.02.12 16:51
There are many indicators which can be used for it. I personally prefer MACD. First of all - because MACD is Moving Average Convergence/Divergence indicator. And because there are some good MACD divergence indicators but for MT4 sorry. If someone creates MACD divergence for MT5 and place it to CodeBase or to Market for low price - it will be very good (and it will be very popular indicator for MT5).
I used MACD divergence for real trading for many months with very good results.
This is the rules for MACD divergence (taken from 'Achelis - Technical Analysis from A to Z'):
Forum on trading, automated trading systems and testing trading strategies
Divergence line on Awesome Oscillator :
TIMisthebest, 2013.09.28 12:58
hi;
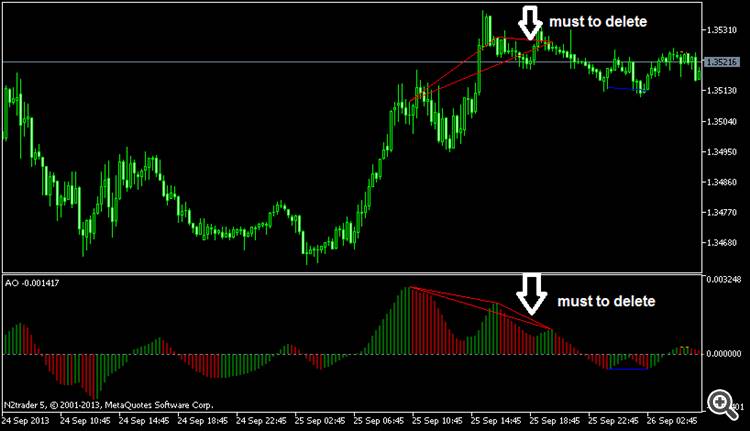
Divergence line on Awesome Oscillator is acceptable: were going through histogramm body OR not?, must have Opposite slope versus Price trend line OR must have Increase/Decrease in slope versus Price trend line ?
i work on an indicator to determinate the Divergence on Awesome Oscillator. ( Regular Divergence & Hidden Divergence )
based on : https://www.mql5.com/en/docs/standardlibrary/expertclasses/csignal/signal_ao
Divergence — the first analyzed bottom of the indicator is shallower
than the previous one, and the corresponding price valley is deeper than the
previous one. In addition, the indicator must not rise above the zero level. ( below pic.)
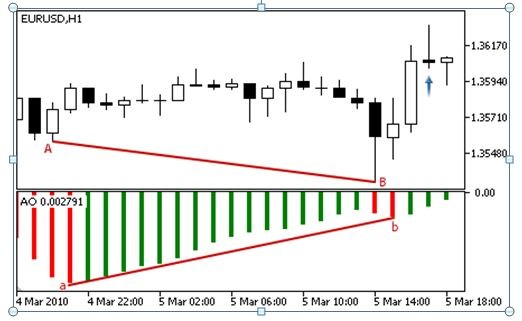
i wrote this ( not complete yet , must add alarm , arrow, send mail, alert, ....). there are all of Divergence type.
------------------------------------------------------------------------------------------------------------------------------------------------------------------------------
my qustion's are :
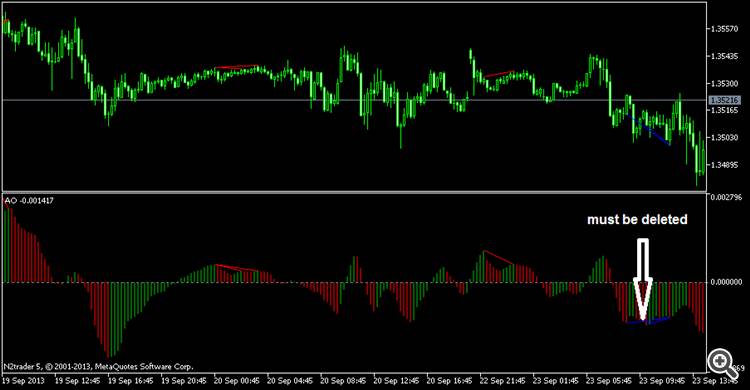
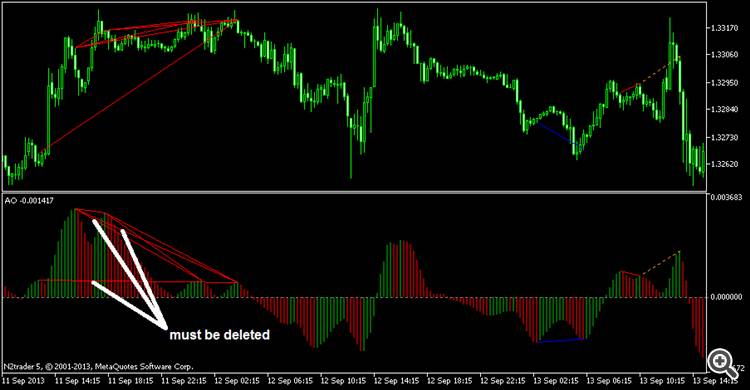
a) case 1 : " it is not Important lines going across through the indicators/histogram body " . as abow picture.
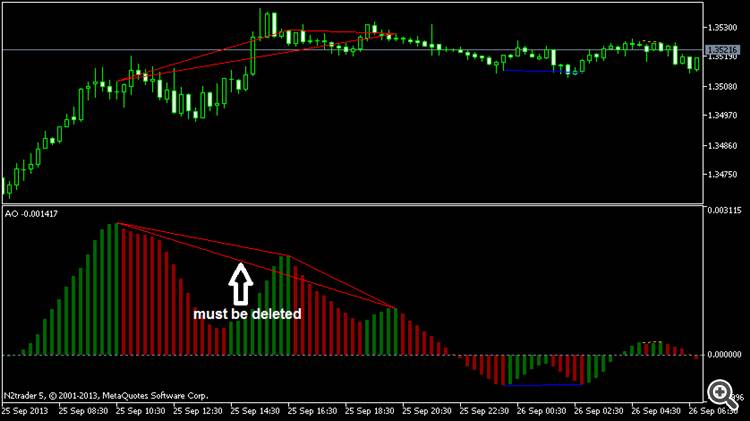
a) case 2 : " lines must be not going across through the indicators/histogram body " .
in this case , so, i must delete that line are going across through the indicators/histogram body by compare with lines equation's & value of Awesome Oscillator.
for example :
or
or
or
------------------------------------------------------------------------------------------------------------------------------------------------------------------------------
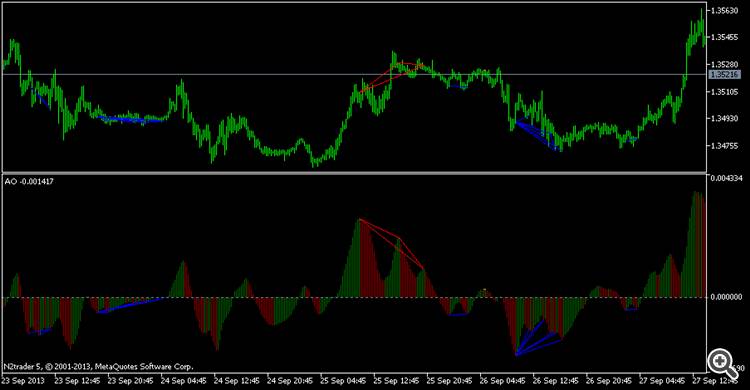
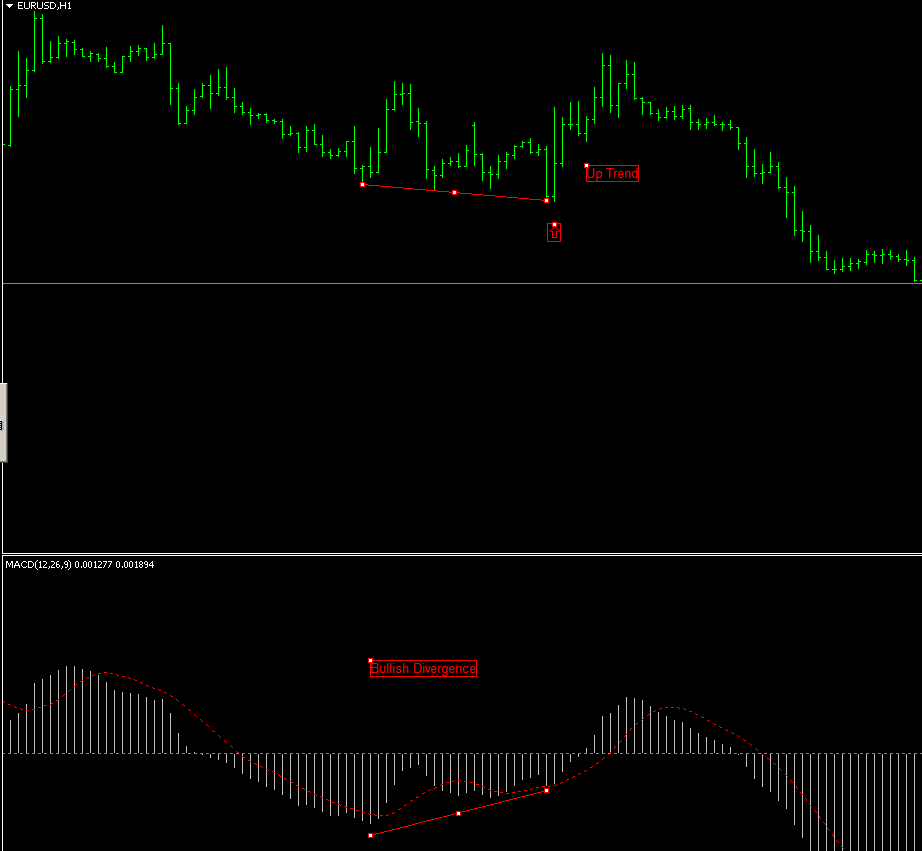
b) case 1 : " must have Increase/Decrease in slope versus Price trend line " . as it is. by using:
               if(Ext_AO_Buffer[bar]<Ext_AO_Buffer[ALL_LastPeak_bar[l]] &&
                 Low[bar]>Low[ALL_LastPeak_bar[l]])
                {
                 DrawIndicatorTrendLine(bar,Time[bar],Time[ALL_LastPeak_bar[l]],
                       Ext_AO_Buffer[bar],Ext_AO_Buffer[ALL_LastPeak_bar[l]],Red,STYLE_SOLID);
                 DrawPriceTrendLine(bar,Time[bar],Time[ALL_LastPeak_bar[l]],
                       High[bar],High[ALL_LastPeak_bar[l]],Red,STYLE_SOLID);
                }
               if(Ext_AO_Buffer[bar]>Ext_AO_Buffer[ALL_LastPeak_bar[l]] &&
                  Low[bar]<Low[ALL_LastPeak_bar[l]])
                 {
                 DrawIndicatorTrendLine(bar,Time[bar],Time[ALL_LastPeak_bar[l]],
                       Ext_AO_Buffer[bar],Ext_AO_Buffer[ALL_LastPeak_bar[l]],Orange,STYLE_DOT);
                 DrawPriceTrendLine(bar,Time[bar],Time[ALL_LastPeak_bar[l]],
                       High[bar],High[ALL_LastPeak_bar[l]],Orange,STYLE_DOT);
                }
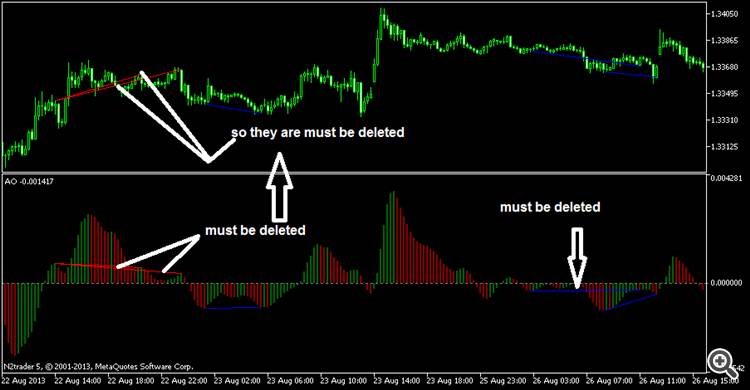
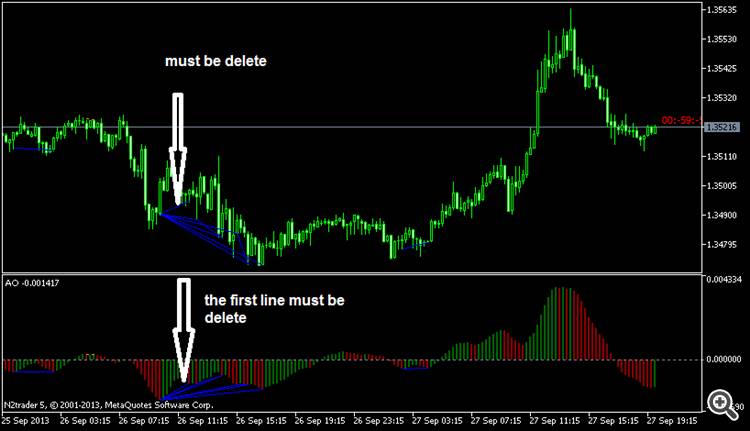
b) case 2 : " lines must have Opposite slope versus Price trend line " .
like:

for example:
or
in this case , so, i must just keep that line's are have Opposite slope versus Price trend line compare with lines equation's ( + or - vs. - or + ).
=====================================================================================================
can you please tell about :
a) case 1 : " it is not Important lines going across through the indicators/histogram body " .
a) case 2 : " lines must be not going across through the indicators/histogram body " .
b) case 1 : " must have Increase/Decrease in slope versus Price trend line " .
b) case 2 : " lines must have Opposite slope versus Price trend line "
thank you.
Forum on trading, automated trading systems and testing trading strategies
Indicators: Relative Strength Index (RSI)
newdigital, 2013.08.07 14:41
RSI Hidden Bullish and Bearish Divergence Trading Setups
Hidden divergence is used as a possible sign for a trend continuation. Hidden divergence occurs when price retraces to retest a previous high or low.
Hidden RSI Bullish Divergence
Forms when price is making a higher low (HL), but the oscillator is showing a lower low (LL).
Hidden bullish divergence occurs when there is a retracement in an uptrend.
This setup confirms that a retracement move is complete. This divergence indicates underlying strength of an uptrend.
Hidden RSI Bearish Divergence
Forms when price is making a lower high (LH), but the oscillator is showing a higher high (HH).
Hidden bearish divergence occurs when there is a retracement in a downtrend.
This setup confirms that a retracement move is complete. This divergence indicates underlying strength of a downtrend.
Forum on trading, automated trading systems and testing trading strategies
newdigital, 2013.08.01 17:00
MACD Hidden Bullish and Bearish Divergence
MACD Hidden divergence is used as a possible sign for a trend continuation.
This setup occurs when price retraces to retest a previous high or low.
1. Hidden Bullish Divergence
2. Hidden Bearish Divergence
Hidden Bullish Divergence
Forms when price is making a higher low (HL), but the MACD oscillator is showing a lower low (LL).
Hidden bullish divergence occurs when there is a retracement in an uptrend.
MACD bullish divergence
This divergence confirms that a retracement move is complete. This divergence indicates underlying strength of an uptrend.
Hidden Bearish Divergence
Forms when price is making a lower high (LH), but the MACD oscillator is showing a higher high (HH).
Hidden bearish divergence occurs when there is a retracement in an uptrend.
MACD bearish divergence
This setup confirms that a retracement move is complete. This diverging indicates underlying strength of a downtrend.
NB: Hidden divergence is the best divergence to trade because it gives a signal that is in the same direction with the trend. It provides for the best possible entry and is more accurate than the classic type of diverging.
Hidden divergence is very interesting and creational.
I think it has priority over regular divergence.
I agree with case1 "not going across through the indicators/histogram body"
and case2 "lines must have Opposite slope versus Price trend line"
I think divergence has such meaning.
- www.mql5.com
Hidden diverence at oscillators informs us accelelation of trend.

In my opinion hidden divergence is very good trend indicator.
- Free trading apps
- Over 8,000 signals for copying
- Economic news for exploring financial markets
You agree to website policy and terms of use
There are many indicators.
Is divergence of technical indicator creditable except for trend indicator?
Please submit your opinion.
I think it is partially meaningful and trend is everything.