Find clicked MqlRate
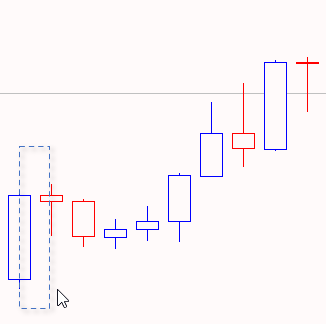
Set the maximum scale of the graph. And you will understand that the border is not in the middle of the candle, but in the middle BETWEEN the candles.
I am sorry but I don't know what exactly you mean and how this helps solving the problem. Could I please get a more detailed explenation?
In the figure, I showed the border of the bar:
return (int)((rates[0].time - reference) / 60) / (PeriodSeconds(timeframe) / 60);This assumes every bar every exists — they don't. What if there are no ticks during a specific candle period? There can be minutes between ticks during the Asian session, think M1 chart. Larger charts, think weekend, market holiday (country and broker specific), requires knowledge of when your broker stops and starts (not necessary the same as the market.)
"Free-of-Holes" Charts - MQL4 Articles (20 June 2006)
No candle if open = close ? - MQL4 programming forum
With this knowledge I updated the x value before giving it to ChartXYToTimePrice:
int bars = ChartGetInteger(0, CHART_WIDTH_IN_BARS);
int width = ChartGetInteger(0, CHART_WIDTH_IN_PIXELS);
int barWidth = width / bars;
x = x - (barWidth / 2);
Now it works, thank you!
This assumes every bar every exists — they don't. What if there are no ticks during a specific candle period? There can be minutes between ticks during the Asian session, think M1 chart. Larger charts, think weekend, market holiday (country and broker specific), requires knowledge of when your broker stops and starts (not necessary the same as the market.)
"Free-of-Holes" Charts - MQL4 Articles (20 June 2006)
No candle if open = close ? - MQL4 programming forum
Okay thank you for the hint. Now I just tried to calculate the number of missing candles and subtract it in numberOfRates:
int numberOfRates(const ENUM_TIMEFRAMES timeframe, const datetime &reference) {
   MqlRates rates[];
   CopyRates(Symbol(), timeframe, 0, 1, rates);
   int res = (int)((rates[0].time - reference) / 60) / (PeriodSeconds(timeframe) / 60);
   return res - numberOfSkippedRates(res, timeframe, reference);
}

int numberOfSkippedRates(const int copy, const ENUM_TIMEFRAMES &timeframe, const datetime &time) {
   if(copy <= 1)
      return 0;

   int res = 0;
   MqlRates rates[];
   ArraySetAsSeries(rates, true);
   CopyRates(Symbol(), timeframe, 0, copy, rates);

   for(unsigned int i = 0; i < (unsigned int) copy-1; ++i) {
      if(rates[i].time < time)
         break;
      res += (int)((rates[i].time - rates[i+1].time) / PeriodSeconds(timeframe)) - 1;
   }
   return res;
}
The idea seems to be right but I do have problems with the "fine-tuning" of numberOfSkippedRates" (where time is the datetime of the bar that I want to count the skipped candles for). Generally it works fine but from time to time there is a bar where it does not work. Any Idea how to fix it?
- Free trading apps
- Over 8,000 signals for copying
- Economic news for exploring financial markets
You agree to website policy and terms of use
Hello, I want to use the click-event to select a candlestick. To find this specific Candlestick I have following code:
Now the problem is that I don't always get the clicked candle but often the next one, depending on where I click the candle. I added an image where I tried to visualize the problem.
Now I am not sure if the problem comes with "ChartXYToTimePrice(...)" or with my help funtions and how I can fix this.