Something Interesting in Financial Video November 2014 - page 2
You are missing trading opportunities:
- Free trading apps
- Over 8,000 signals for copying
- Economic news for exploring financial markets
Registration
Log in
You agree to website policy and terms of use
If you do not have an account, please register
The Phases Of The Moon And Stock Market Performance
Kevin Barry of the Traders & Investors Club discusses how the performance of global stock markets varies depending upon the phases of the moon. Could investing for one half of the month only be a viable strategy? You decide.
This video takes a look at the supply (i.e. amount mined) and demand of silver relative to platinum. Which one has the greater supply/demand imbalance, and thus might be a better value opportunity? Watch the video to find out.
In this video:
00:40 Big moves on the USD/JPY pair
02:10 The importance of trading what you see and not what you think
04:19 The safest way to trade during Non Farm Payroll
50% or more of the trades are losers. These trading strategies and traders are successful not because they are highly accurate on a trade by trade basis, but because when they are wrong they cut their losses quickly and when they are right they let their profits run. While the trading strategy that you eventually end up trading for yourself may have a higher success rate than what I mention above, any strategy is going to have loosing trades, so the first key to staying in the game is to have a plan for managing those losses so they do not get out of control and wipe out your chances for success.
Traders who set their per trade risk level at 2% of their trading capital or less, not only put themselves in a situation where a fairly lengthy string of losses will not knock them out of the game, but also put themselves in a situation where any one trade is not going to make or break their account. This is important not only from a money management standpoint but also from a trading psychology standpoint in that they are not attached to any one trade and are therefore more likely to stick to their strategy.
In order to have a true understanding of what this number should be for a specific strategy you will need to know what the expected accuracy rate is for the strategy, something which will cover in later lessons. For now however it is sufficient to simply understand that you need to have a feel for how much you plan to risk on a per trade basis as a first step in designing a successful money management strategy, and that you should be very wary of any strategy which risks more than 2% of your trading capital on any one trade.
Now that we understand that determining how much to risk per trade is the first step in any successful money management strategy, we can move on to other methods of setting your initial stop which fit within the limit set by the amount a trader is willing to risk on a per trade basis.
Forum on trading, automated trading systems and testing trading strategies
Press review
newdigital, 2014.11.18 15:01
Price & Time: USD Head Fake? (based on dailyfx article)
Forum on trading, automated trading systems and testing trading strategies
Press review
newdigital, 2014.11.21 06:21
Scalping the AUDUSD Correction- Longs Favored Above 8565 (based on dailyfx article)
Forum on trading, automated trading systems and testing trading strategies
Press review
newdigital, 2014.11.24 17:40
Focus on the Japanese Yen in the Week Ahead
Forex "Holy Grail" Syndrome
Do you suffer from Forex “Holy Grail” syndrome?
If you do there is no need to panic but early diagnosis is critical! This is a very common disorder that effects statistically about 90% -95% of new Forex traders, but is very treatable with the proper education and trade style changes. However, left undiagnosed and untreated, Holy Grail syndrome will significantly decrease the life expectancy of your Forex trading business.
Forum on trading, automated trading systems and testing trading strategies
Press review
newdigital, 2014.11.25 09:04
Precious Metals Exposed To Greenback Gains On Top-Tier US Data (adapted from dailyfx article)
Crude oil witnessed a rocky start to the week with the WTI benchmark off by 1.28% for the session. Global supply glut concerns were fanned by reports that several OPEC members would be excluded from production cuts. This comes ahead of a scheduled meeting amongst the petroleum producers later this week. While negative supply side cues remain, the crude benchmarks could continue to remain under pressure.
Meanwhile the precious metals witnessed a mixed session as their US Dollar counterpart drifted sideways amid a void of major US data. Looking to the session ahead, the greenback may take some guidance from revised Q3 GDP and Consumer Confidence figures. Given the generally positive sentiment towards the USD at present, it would likely take a material downside surprise to turn the tide against the reserve currency. This in turn could leave gold and silver exposed.
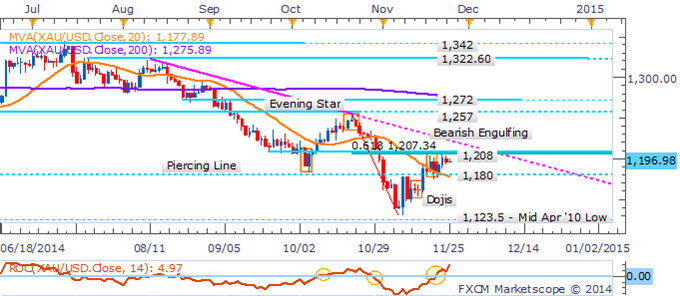
Gold remains at a crossroads as trend indicators warn of building upside momentum (20 SMA and ROC). Yet it is still capped below key resistance at 1,208 (also the 61.8% Fib.). This leaves a clearer setup desired to offer a more concrete technical bias.
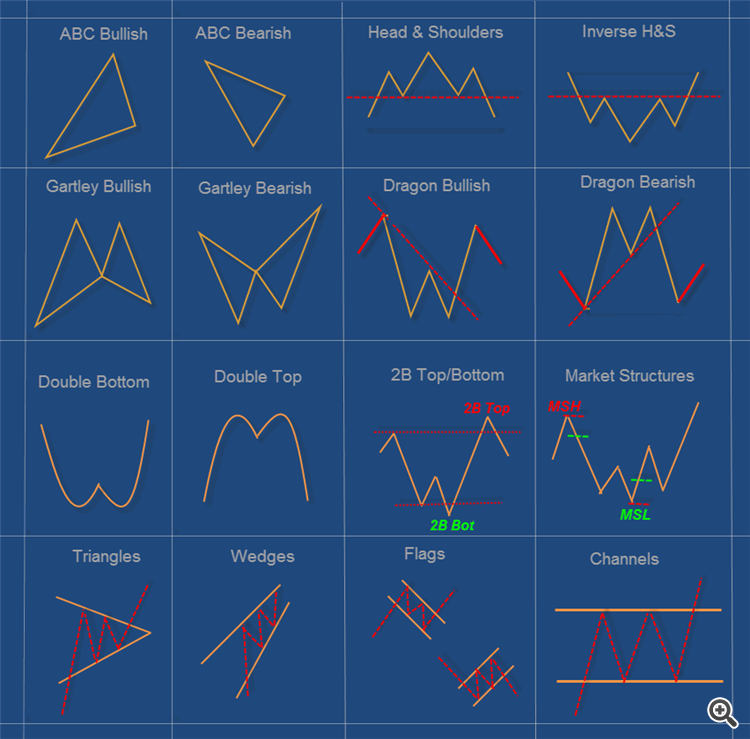
Suri Duddella, Webinar: The Success and Failure of Chart Patterns
Suri Duddella, 19+ years full-time Futures/Equities/Options Trader. Patterns based Algorithmic Trading. Author -- "Trade Chart Patterns Like The Pros" book.
======
A chart pattern is a distinct formation on a stock chart that creates a trading signal, or a sign of future price movements. Chartists use these patterns to identify current trends and trend reversals and to trigger buy and sell signals.
Identifying chart patterns is simply a system for predicting stock market trends and turns! Well, a trend is merely an indicator of an imbalance in the supply and demand. These changes can usually be seen by market action through changes in price. These price changes often form meaningful chart patterns that can act as signals in trying to determine possible future trend developments. Research has proven that some patterns have high forecasting probabilities. These patterns include: The Cup & Handle, Flat Base, Ascending and Descending Triangles, Parabolic Curves, Symmetrical Triangles, Wedges, Flags and Pennants, Channels and the Head and Shoulders Patterns.