How can I set CopyRates for timeframe array elements
It is not clear what you are trying to get. The screen is not attached.
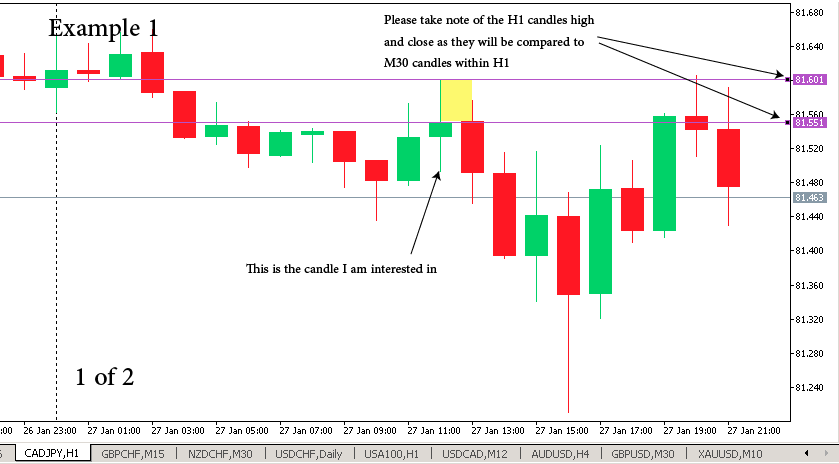
I am trying to find all consecutive timeframe pairs (for timeframes from M2 to H1) that preserve a candlestick’s upper wick for the duration of a week and keep updating the pairs regions drawn every 5 minutes. A rectangle will be drawn for the wick area. Let me explain further:
This is the array of timeframes I’m using: [H1, …, M2] and I’m trying to find all the consecutive timeframe pairs (H1, M30), (M6, M5), (M15, M12), (M12, M10) and so on such that for example M12’s upper wick is the same as M15’s upper wick and M12 is contained in M15 since they are consecutive pairs.
When price passes both the open/close and high (or upper wick) then this region is no longer valid.
Please see the attached screenshots for more info on the pattern.
Please see what I’ve done below:
My main issue is how to set the CopyRates() for timeframe array elements. My other issue is how to get my results for a period a week and update them every 5 minutes.
I was trying to edit the question but I didn't see the edit button. I'm not sure whether it's because I asked the question quite a while ago.
Here are some screenshots with a better explanation.

Now taking the timeframes array above that I provided, I want to do a comparison similar to the one I did with H1 and M30 (checking to make sure their upper wicks have the same high and close/open), with the following elements:
First array element (PERIOD_H2) and second (PERIOD_H1),
Second array element (PERIOD_H1) and third (PERIOD_M30),
third array element (PERIOD_M30) and forth (PERIOD_M20),
forth array element (PERIOD_M20) and fifth (PERIOD_M15),
.
.
.
last but one array element (PERIOD_M3 )and last array element (PERIOD_M2)
Each resulting High and open/close should be marked with a rectangle on the chart (I have written code for drawing rectangles).
When price passes both the High and open/close of the candle then the zone is no longer valid and should be filtered out.
The above comparisons of the timeframes should be done for the past 5 days up until the current last 15 minutes. Also the 5 days should be updated every 15 minutes.
It is not clear what you are trying to get. The screen is not attached.
Thanks for replying.
I couldn't edit the original question but I just commented on it with an updated explanation with screenshots.
To be very honest I have been over the docs you linked several times and I am struggling to figure out how to apply them directly to solve my specific problem with timeframe array elements.
Copy data from a smaller timeframe using time parameters. For example, the H2 bar time is 2021.01.02 02:00, copy the data from H1:
MqlRates r []; datetime tm = D'2021.01.02 02:00 ';

CopyRates (Symbol (), PERIOD_H1, tm + PeriodSeconds (PERIOD_H2) -1, tm, r);
After that, you will have an array of 2 or 1 elements (if one bar is missing).
But still, your task is not clear to me.
Copy data from a smaller timeframe using time parameters. For example, the H2 bar time is 2021.01.02 02:00, copy the data from H1:
After that, you will have an array of 2 or 1 elements (if one bar is missing).
But still, your task is not clear to me.
Okay.
Basically what I want to do is draw rectangles over candlesticks that satisfy my pattern condition. Drawing of the rectangles isn’t my main issue. It’s getting the pattern.
I have an array of timeframes
{PERIOD_H2, PERIOD_H1, PERIOD_M30, PERIOD_M20, PERIOD_M15, PERIOD_M12, PERIOD_M10, PERIOD_M6, PERIOD_M5, PERIOD_M4, PERIOD_M3, PERIOD_M2};
and I want to search for a candlestick pattern.
The candlestick pattern compares the upper wicks of candlesticks from two different consecutive timeframes at a time. In this way:
First array element (PERIOD_H2) and second (PERIOD_H1),
Second array element (PERIOD_H1) and third (PERIOD_M30),
third array element (PERIOD_M30) and forth (PERIOD_M20),
forth array element (PERIOD_M20) and fifth (PERIOD_M15),
.
.
.
last but one array element (PERIOD_M3 )and last array element (PERIOD_M2)
Once a valid pair of timeframes (for example, PERIOD_M12 and PERIOD_M10, where PERIOD_M10 candle is contained in PERIOD_M12 and they have the same high and close/open, depending on if the candle is bullish or bearish) satisfies the condition a rectangle is drawn that extends to the current time.
So there are four important things to note about the pattern:
- only two consecutive timeframes should be searched and compared from the timeframes array
- both candles should be bearish or bullish
- since one timeframe is bigger than the other, the smaller one is contained in the bigger one
- the highs of candles from a valid pair of timeframes should be the same and the open/close should also be the same.
I am trying to show this pattern for the past 5 trading days or 1 week and keep updating the rectangle regions every 15 minutes as new candles are formed.
I really hope this makes things a lot clearer.
This example should check if high on all timeframes are equal while all close prices are smaller than open.
//---
#include <ChartObjects\ChartObjectsArrows.mqh>
#include <Arrays\ArrayObj.mqh>
CArrayObj ars;
//---
struct CRates
  {
   MqlRates          m_rates[],rates;
   bool              CopyRates(ENUM_TIMEFRAMES timeframe)
     {
      if(::CopyRates(_Symbol,timeframe,1,1,m_rates)==1)
        {
         rates=m_rates[0];
         return(true);
        }
      return(false);
     }
   bool      operator>=(CRates &that) { return(this.rates.low==that.rates.low && this.rates.close>this.rates.open && that.rates.close>that.rates.open); }
   bool      operator<=(CRates &that) { return(this.rates.high==that.rates.high && this.rates.close<this.rates.open && that.rates.close<that.rates.open); }
//---
  }tfs[];
//---
input datetime refreshDuration = PERIOD_M5;
//---
ENUM_TIMEFRAMES Timeframes[] = {PERIOD_H2, PERIOD_H1, PERIOD_M30, PERIOD_M15, PERIOD_M5};
//+------------------------------------------------------------------+
//| Expert initialization function                                   |
//+------------------------------------------------------------------+
int OnInit()
  {
//---
   if(ArrayResize(tfs,ArraySize(Timeframes))==-1)
      return(INIT_FAILED);
//---
   if(MQLInfoInteger(MQL_TESTER))
      ars.FreeMode(false);
//---
   return(INIT_SUCCEEDED);
  }
//+------------------------------------------------------------------+
//| Expert deinitialization function                                 |
//+------------------------------------------------------------------+
void OnDeinit(const int reason)
  {
//---

  }
//+------------------------------------------------------------------+
//| Expert tick function                                             |
//+------------------------------------------------------------------+
void OnTick()
  {
//---
   static datetime preTime=0,curTime=0;
   if((curTime=iTime(_Symbol,PERIOD_M5,0))==preTime)
      return;
   preTime=curTime;
//---
   int size=ArraySize(Timeframes);
   for(int i=0;i<size;i++)
      if(!tfs[i].CopyRates(Timeframes[i]))
         return;
//---
   for(int i=1;i<size;i++)
     {
      if(!(tfs[i-1]<=tfs[i]))
         break;
      ArrowHigh(tfs[i].rates.time,tfs[i].rates.high);
     }
//---
  }
//+------------------------------------------------------------------+
//|                                                                  |
//+------------------------------------------------------------------+
bool ArrowHigh(const datetime time,const double price)
  {
   CChartObjectArrow *high;
   if(!CheckPointer(high=new CChartObjectArrow) ||
      !high.Create(ChartID(),"high "+TimeToString(time),0,time,price,119))
     {
      Print("error creating arrow: ",(string)GetLastError());
      return(false);
     }
   high.Color(clrRed);
   high.SetInteger(OBJPROP_WIDTH,5);
   high.SetInteger(OBJPROP_HIDDEN,false);
   ars.Add(high);
   ChartRedraw();
   return(true);
  }
//+------------------------------------------------------------------+
...
I have shown above how to copy the bars of a small timeframe that are included in one bar of a larger timeframe. Now we need to find the minimum and maximum prices. Use "for" to fnd the minimum and maximum price values in r array. Time coordinates are in the start and end elements of the array.
I have shown above how to copy the bars of a small timeframe that are included in one bar of a larger timeframe. Now we need to find the minimum and maximum prices. Use "for" to fnd the minimum and maximum price values in r array. Time coordinates are in the start and end elements of the array.
I am trying to figure out how we'll be using the minimum and maximum prices to determine if for example, an H2 bullish candle's high and close are the same as a contained H1 bullish candle's high and close.
Since the code you provided contains the smaller timeframe bars how will they be compared to the bigger timeframe bars?
I would really appreciate some further explanation to understand this better.
This example should check if high on all timeframes are equal while all close prices are smaller than open.
Thanks. I'll carefully go through the code and make sure I understand how to apply it specifically to my problem.
- Free trading apps
- Over 8,000 signals for copying
- Economic news for exploring financial markets
You agree to website policy and terms of use
I am trying to find all consecutive timeframe pairs (for timeframes from M2 to H1) that preserve a candlestick’s upper wick for the duration of a week and keep updating the pairs regions drawn every 5 minutes. A rectangle will be drawn for the wick area. Let me explain further:
This is the array of timeframes I’m using: [H1, …, M2] and I’m trying to find all the consecutive timeframe pairs (H1, M30), (M6, M5), (M15, M12), (M12, M10) and so on such that for example M12’s upper wick is the same as M15’s upper wick and M12 is contained in M15 since they are consecutive pairs.
When price passes both the open/close and high (or upper wick) then this region is no longer valid.
Please see the attached screenshots for more info on the pattern.
Please see what I’ve done below:
My main issue is how to set the CopyRates() for timeframe array elements. My other issue is how to get my results for a period a week and update them every 5 minutes.