How to extend DRAW_ARROW to the right?


Hi! I am making a few adjustments in the Fractals indicator from MetaQuotes and i am trying to create more dots to the right, like a support and resistance line, i need 5 more dots to the right instead of just one but i am having a hard time doing it

Can someone show me the way? I needed something like this but with a fixed amount of 5 dots if possible, i have some idea of what is controlling the dots but i am not being able to find how to add more.

asd

This is the Fractals code:

https://www.mql5.com/pt/code/30

 //+------------------------------------------------------------------+
//|                                                     Fractals.mq5 |
//|                        Copyright 2009, MetaQuotes Software Corp. |
//|                                              http://www.mql5.com |
//+------------------------------------------------------------------+
#property copyright "2009, MetaQuotes Software Corp."
#property link      "http://www.mql5.com"
//---- indicator settings
#property indicator_chart_window
#property indicator_buffers 2
#property indicator_plots   2
#property indicator_type1   DRAW_ARROW
#property indicator_type2   DRAW_ARROW
#property indicator_color1  Gray
#property indicator_color2  Gray
#property indicator_label1  "Fractal Up"
#property indicator_label2  "Fractal Down"
//---- indicator buffers
double ExtUpperBuffer[];
double ExtLowerBuffer[];
//--- 10 pixels upper from high price
int    ExtArrowShift=-10;
//+------------------------------------------------------------------+
//| Custom indicator initialization function                         |
//+------------------------------------------------------------------+
void OnInit()
  {
//---- indicator buffers mapping
   SetIndexBuffer(0,ExtUpperBuffer,INDICATOR_DATA);
   SetIndexBuffer(1,ExtLowerBuffer,INDICATOR_DATA);
   IndicatorSetInteger(INDICATOR_DIGITS,_Digits);
//---- sets first bar from what index will be drawn
   PlotIndexSetInteger(0,PLOT_ARROW,167);
   PlotIndexSetInteger(1,PLOT_ARROW,167);
//---- arrow shifts when drawing
   PlotIndexSetInteger(0,PLOT_ARROW_SHIFT,ExtArrowShift);
   PlotIndexSetInteger(1,PLOT_ARROW_SHIFT,-ExtArrowShift);
//---- sets drawing line empty value--
   PlotIndexSetDouble(0,PLOT_EMPTY_VALUE,EMPTY_VALUE);
   PlotIndexSetDouble(1,PLOT_EMPTY_VALUE,EMPTY_VALUE);
//---- initialization done
  }
//+------------------------------------------------------------------+
//|  Accelerator/Decelerator Oscillator                              |
//+------------------------------------------------------------------+
int OnCalculate(const int rates_total,const int prev_calculated,
                const datetime &Time[],
                const double &Open[],
                const double &High[],
                const double &Low[],
                const double &Close[],
                const long &TickVolume[],
                const long &Volume[],
                const int &Spread[])
  {
   int i,limit;
//---
   if(rates_total<5)
      return(0);
//---
   if(prev_calculated<7)
     {
      limit=2;
      //--- clean up arrays
      ArrayInitialize(ExtUpperBuffer,EMPTY_VALUE);
      ArrayInitialize(ExtLowerBuffer,EMPTY_VALUE);
     }
   else limit=rates_total-5;

   for(i=limit;i<rates_total-3 && !isstopped();i++)
     {
      //---- Upper Fractal
      if(High[i]>High[i+1] && High[i]>High[i+2] && High[i]>=High[i-1] && High[i]>=High[i-2])
         ExtUpperBuffer[i]=High[i];
      else ExtUpperBuffer[i]=EMPTY_VALUE;

      //---- Lower Fractal
      if(Low[i]<low[i+1] && low[i]<low[i+2] && low[i]<=low[i-1] && low[i]<=low[i-2])
         ExtLowerBuffer[i]=Low[i];
      else ExtLowerBuffer[i]=EMPTY_VALUE;
     }
//--- OnCalculate done. Return new prev_calculated.
   return(rates_total);
  }

//+------------------------------------------------------------------+

  </low[i+1] && low[i]<low[i+2] && low[i]<=low[i-1] && low[i]<=low[i-2])
</rates_total-3 && !isstopped();i++)


Thanks in advance.

Fractals
Fractals
  • www.mql5.com
O Fractal é um dos 5 indicadores do sistema de negociação de Bill Williams, que permite detectar topos e fundos.
 

Example of indicator: Fractals Corridor Breakdown

When a fractal appears, extend it until a new one is found so that you can see more clearly where the price will break through the fractal. The candlestick that breaks through the fractal is colored:
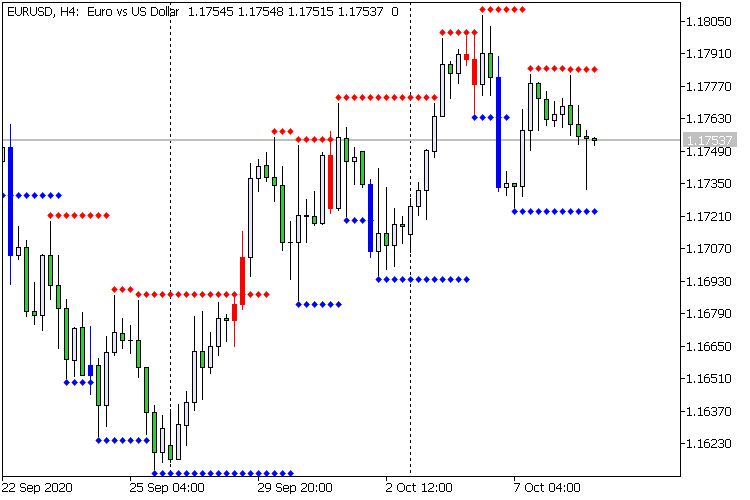
Fractals Corridor Breakdown

Figure: 1. Fractals Corridor Breakdown

Thus, the indicator visualizes a line from the fractal and a candlestick that breaks through the fractal.

Fractals Corridor Breakdown
  • www.mql5.com
Индикатор на основе iFractals. Плюс зарисовка свечи, которая пробивает фрактал
Reason: