Discussion of article "CatBoost machine learning algorithm from Yandex with no Python or R knowledge required" - page 3
You are missing trading opportunities:
- Free trading apps
- Over 8,000 signals for copying
- Economic news for exploring financial markets
Registration
Log in
You agree to website policy and terms of use
If you do not have an account, please register
Ah, try repeating the same experiment, only adding another month or two of history to the training sample and then compare the two tests. Whether the neural network will remain stable, what influence more recent price movements have on this model...
Careful - this is not a neural network, but gradient bousting - a very different approach to finding a pattern, although both are machine learning methods.
I'm convinced that data is scarce on short samples, but I'm training samples now to satisfy readers' curiosity:
1. one year window with different number of trees - let's compare the result. (no control sample is used)
2. Window for year 3 with different number of trees - compare the result. (no control sample is used)
3. window for a year with new data added every month with different number of trees - compare the result. (no control sample is used)
You will have to wait for the computational process to complete - there are many models being built.
Let's move from abstractions to numbers. How much will a small window be effective?
The point is that you suggest jumping after market conditions, while I suggest using knowledge about different market conditions. The more knowledge backed by history, the slower the patterns built on it will change.
And then, how do you define hyperparameters on a small sample - how many training iterations at least. I put the same everywhere.The width should be at least as wide as the width of the stable states, on which you can get a profit. I'm not suggesting it, I realise it's difficult for today. Thought from the provisions that learning is productive on stable states. That is, the result of training on a stable BP state will be better than on the same amount of data, but the BP state will consist of several segments of different stable states.
The width should be at least as wide as the width of the stable states that you can profit on. I am not suggesting this, I realise that it is difficult for today. The thought from the clauses is that learning is efficient on stable states. That is, the result of training on a stable BP state will be better than on the same amount of data, but the BP state will consist of several segments of different stable states.
Thus, we can find out the optimal width only after we can detect a new market state.
Here in the article we do not use time series in their pure form, because the data collection is based on a certain market state, and there are different number of bars between the states.
Careful - it's not a neural network, but gradient bousting - a very different approach to finding a pattern, although both of these methods are related to machine learning.
I am convinced that data is scarce on short samples, but I am training samples now to satisfy readers' curiosity:
1. one year window with different number of trees - let's compare the result. (no control sample is used)
2. Window for year 3 with different number of trees - compare the result. (no control sample is used)
3. window for a year with new data added every month with different number of trees - compare the result. (no control sample is used)
We will have to wait for the computational process to complete - there are many models being built.
That's right... The interesting question for me is - can gradient bousting be used to look for patterns on which to sample data to train a neural network? This is the problem of finding a solution to hedge trades with neural networks trained on different market patterns...
That's right... For me, the interesting question is - can gradient bousting be used to look for patterns on which to sample data to train a neural network? This is the problem of finding a solution to hedge trades with neural networks trained on different market patterns...
How do you plan to get an answer to the question without experimenting with neural networks on a sample?
We can estimate the performance of predictors over time, for example the percentage of closing from "something out there" - you can see on the chart that the bias varies over the rows (each row N rows of the sample) - and if we take 1/10 of the sample, we will not have enough information when the indicator moves sideways (for example it depends on the global trend on the upper TF).
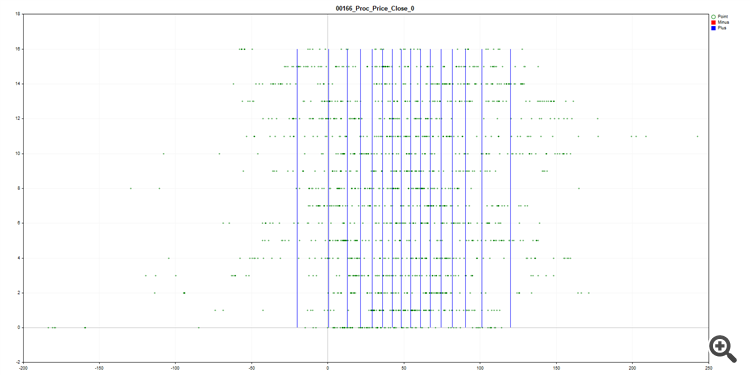
By the way, the figure shows how the data is partitioned (quantised) in the form of a SatBoost grid.For now, the first version is ready:
1. window for a year with different number of trees - let's compare the result. (no control sample is used)
400 trees is not enough and 1600 is excessive.
The dynamics of the curves are similar, any ideas why?
The first draft is ready for now:
1. window for a year with different number of trees - let's compare the result. (no control sample is used)
400 trees is not enough and 1600 is excessive.
The dynamics of the curves are similar, any ideas why?
200 is not enough information, and 1600 there is a loss of information, or not identifying significant information.
200 is missing information, and 1600 there is a loss of information, or not identifying significant information.
The information is stably the same for training, but the memory size for remembering the conditions is different. I think that the similarity of trees in the first ten determines the basic logic of the model's behaviour, and further on there is only its improvement, that is why the curves are similar in their breaks.
2.window for year 3 with different number of trees - compare the result. (no control sample is used)
Again we observe that 800 iterations is optimal, so for the third variant I did not do more. What is confusing is a strong failure in March 2020 - whether it is the impact of the crisis beyond the model, or a sampling error - I did the training on gluing and there could be a gap due to the transition to a new futures contract, which did not happen in real life. On the positive side, the learning is clearly better than at 12 months (see this time period on the last chart!), which is good to see and shows again that 12 months does not accommodate all the variability of the market.
3. window for a year with new data added every month with a different number of trees - let's compare the result.(no control sample is used)
The figure shows that the growth of the model from 400 iterations was faster or in line, but as the sample size increased, the trend changed and the model from 800 iterations started to pull away with fewer errors and better month closure. Apparently, we need to dynamically increase the model size here.
From this study we can conclude that the method outlined in the article and the result obtained is not a fluke.
Yes, I agree that there are significant changes in price behaviour, and the old behaviour is not repeated, and accordingly, sampling over a large period will prevent you from making money on the new data. Identifying variability in price behaviour on a model is subject to further research, but I prefer to use as much price information as possible, albeit slightly out of date.
The figure below provides information on Recall - the blue histogram is the models with sample accumulation and the red histogram is the models with a fixed window of 12 months.
It can be seen that the 12 month models tried to adjust to the current market situation and had more recalls in a number of low volatility periods, while the models with accumulation explicitly in 2020 used the experience of increased volatility in 2014-2016 and were able to recognise strong movements during the 2020 crisis.