Discussion of article "What is a trend and is the market structure based on trend or flat?" - page 11
You are missing trading opportunities:
- Free trading apps
- Over 8,000 signals for copying
- Economic news for exploring financial markets
Registration
Log in
You agree to website policy and terms of use
If you do not have an account, please register
Thank you very much for this market insight and explanation
Where is the MAX_distribution indicator?
it is not freely available
How to get it.
How to get it.
At the moment, no way, I am not distributing this indicator now. Perhaps in the future I will make another indicator and I can share it
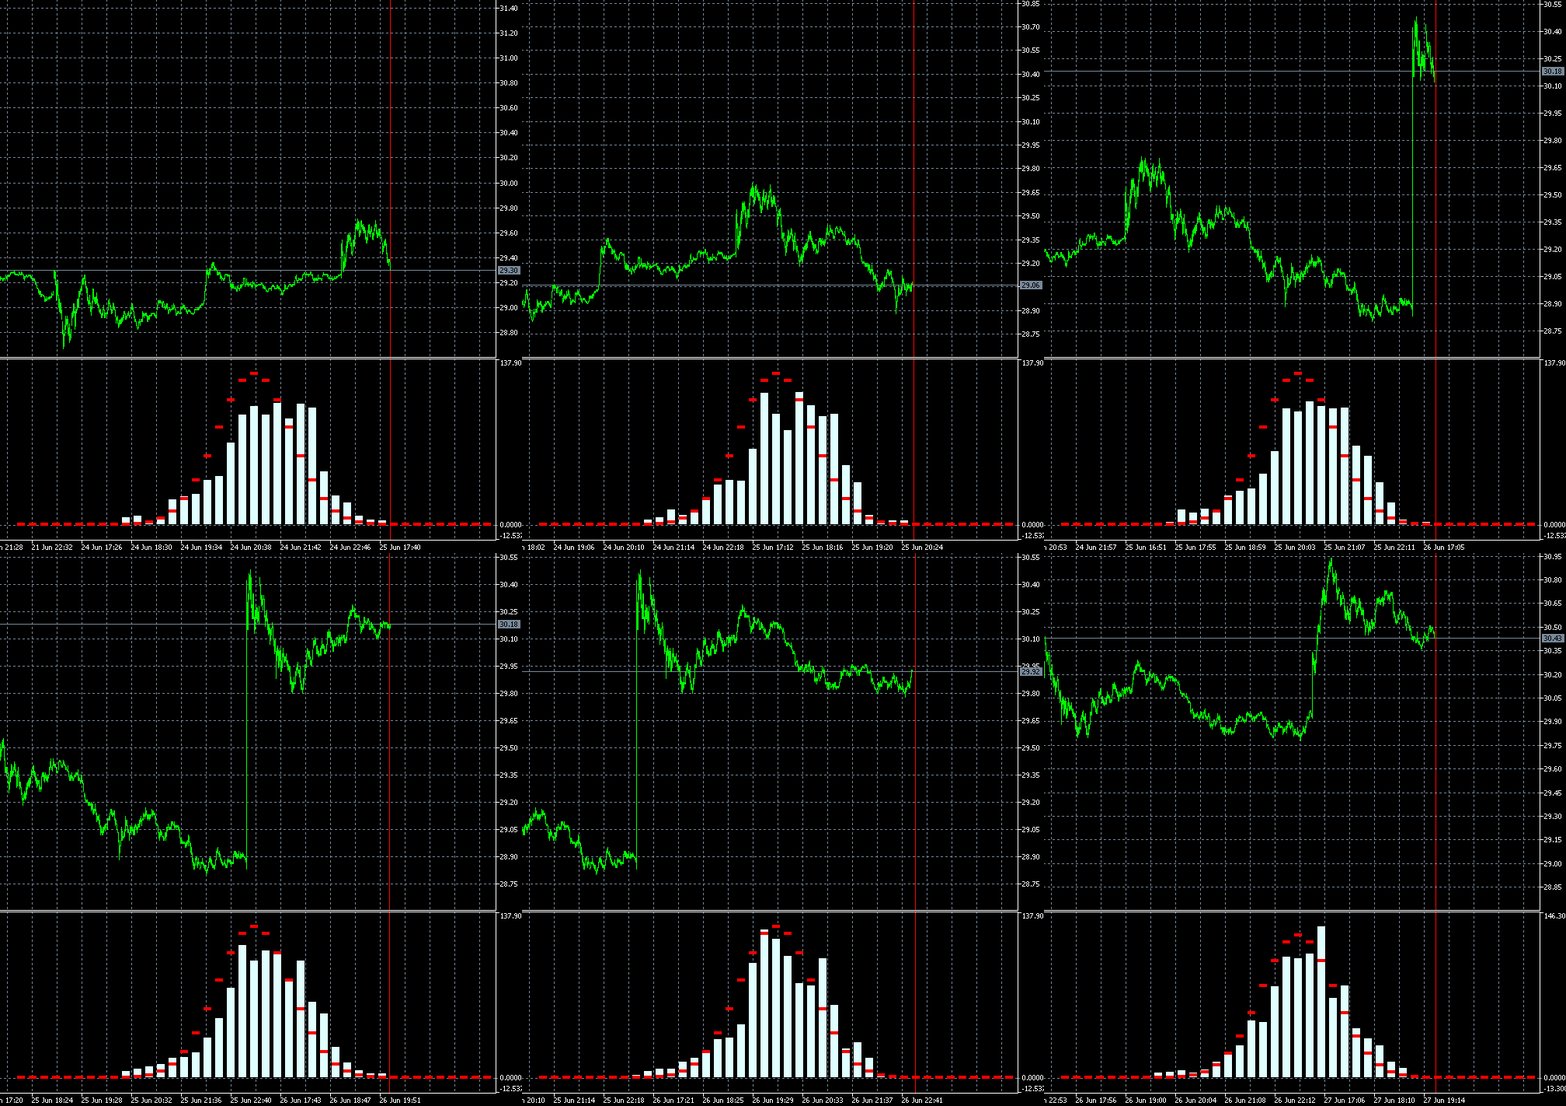
The histogram bars jump suspiciously much when changing by only 1 bar: supposedly 1 bar out of 1000 should be removed from the end and 1 bar should be added at the beginning. I.e. the change should be in the proportion of 1/500 for all bars of the histogram at once, practically 1 or 2 bars should change.

I thought that maybe the speed is high and I don't notice smoothness...

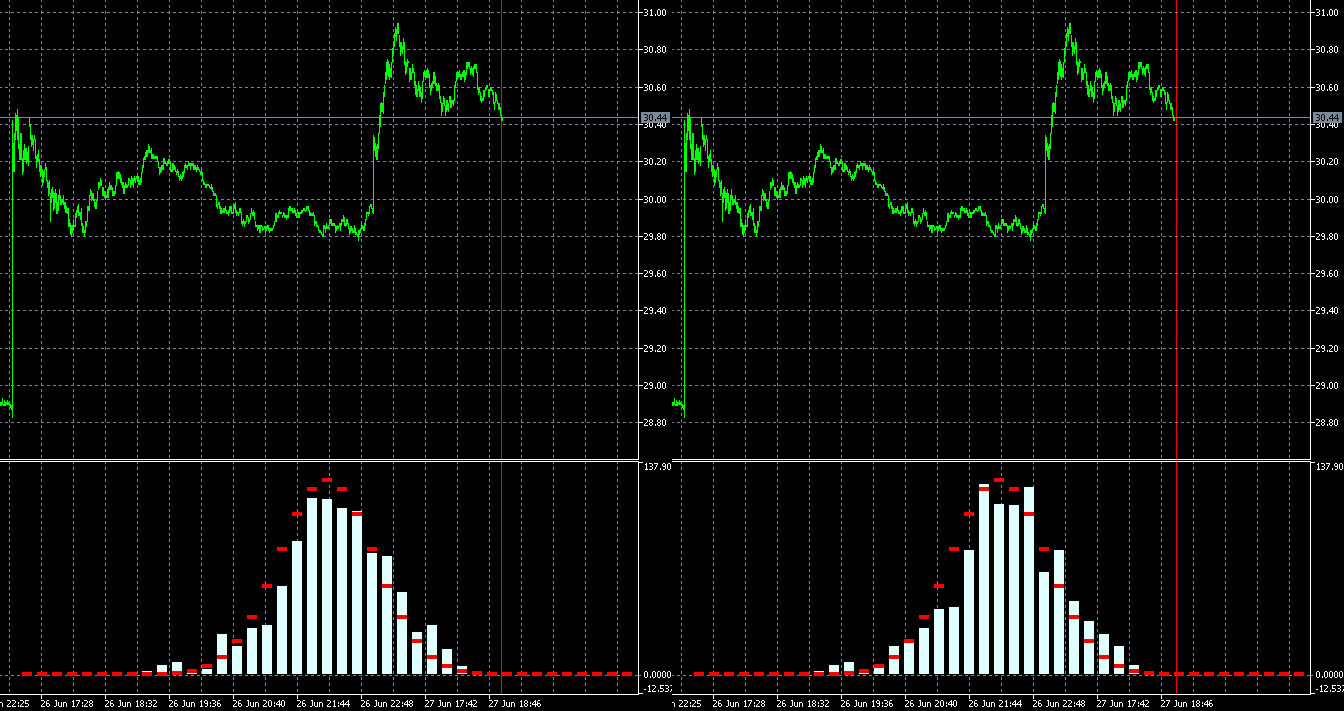
I copied 2 frames 340 and 341 with neighbouring bars and made slower:
The changes are very strong in all bars at once. Maybe there is a mistake somewhere in their calculation? 2 bars out of 1000 can't change the picture like that.
It seems that not 2 bars have changed in the calculation, but all 1000, like the window for 1000 (for a week, month...) has shifted to the past, not for 1 bar.
The histogram bars jump suspiciously much when changing by only 1 bar: supposedly 1 bar out of 1000 should be removed from the end and 1 bar should be added at the beginning. I.e. the change should be in the proportion of 1/500 for all histogram bars at once, practically 1 or 2 bars should change.
I thought that maybe the speed is high and I don't notice smoothness...
I copied 2 frames 340 and 341 with neighbouring bars and made slower:
The changes are very strong in all bars at once. Maybe there is a mistake somewhere in their calculation? 2 bars out of 1000 can't change the picture like that.
It seems that not 2 bars have changed in the calculation, but all 1000, like the window for 1000 (for a week, month...) has shifted to the past, not for 1 bar.
Yes, it may seem suspicious) But there is a peculiarity in the construction of blocks. Blocks are built not in the future, but in the past from the last date. Accordingly, when a candle comes, the price of building blocks shifts and the blocks themselves turn out to be different. A shift of even 10 points can change the configuration of blocks and, consequently, the shape of distribution.
Why I did it this way. There are 2 reasons
1. The method of building blocks is very sensitive to the initial price and I wanted to see how the distribution changes when building from different prices. This approach allowed me to see in dynamics how the distribution changes over time and how the distribution changes from the initial price.
2. I made a block indicator for a large robot and there I used exactly this approach to avoid optimising parameters for history. Since block configurations change a lot from initial conditions, a shift of 1 day forward/backward kills all optimisation of parameters for history. This way we can avoid rough fitting to history and evaluate how stable the detected patterns are. It was important for me to make a robot that works on any trading instrument without optimising parameters
Yes, it may seem suspicious) But there is a peculiarity in the construction of blocks. Blocks are built not in the future, but in the past from the last date. Accordingly, when a candle comes, the price of building blocks shifts and the blocks themselves turn out to be different. A shift of even 10 pips can change the configuration of blocks and, consequently, the shape of distribution.
Why I did it this way. There are 2 reasons
1. The block building method itself is very sensitive to the initial price and I wanted to see how the distribution changes when building from different prices. This approach allowed me to see in dynamics how the distribution changes with time and how the distribution changes with the change of the initial price.
2. I made a block indicator for a large robot and there I used exactly this approach to avoid optimising parameters for history. Since block configurations change a lot from initial conditions, a shift of 1 day forward/backward kills all optimisation of parameters for history. This way we can avoid rough fitting to history and evaluate how stable the detected patterns are. It was important for me to make a robot that works on any trading instrument without optimising parameters
I understood the reason for such jumps, but I still don't like it. Is this histogram indicator posted somewhere? It is interesting to see it live, not on a picture.
I thought about the algorithm of MA calculation: 1 removed, 1 added.
I understood the reason for such jumps, but I still don't like it. Is this histogram indicator posted somewhere? It is interesting to see it live, not on a picture.
No, I have not posted a ready indicator