MACD + Stochastic vertical line indicator
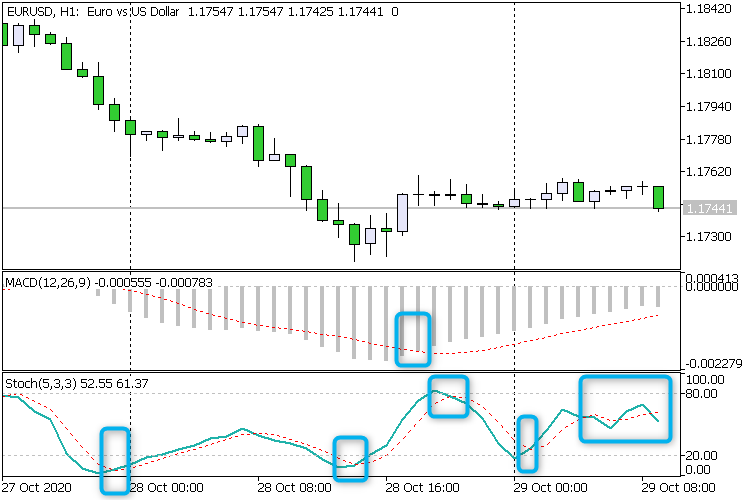
I don't know if this is the correct place to ask...but anyway is there any FREE indicators that draw vertical line when MACD and Stochastic moving in synced. Like example below
If there is none existence how much cost to code this one?
Try on "Stochastic MACD" as an alternative,if not you found what you saying

I don't know if this is the correct place to ask...but anyway is there any FREE indicators that draw vertical line when MACD and Stochastic moving in synced. Like example below
If there is none existence how much cost to code this one?
How do you define "synchronicity"? By eye? Or is there a mathematical description of the term "synchronicity"?
How do you define "synchronicity"? By eye? Or is there a mathematical description of the term "synchronicity"?
What i meant exactly based on mathmetical descriptions
When Both MACD + Stochastic then display vertical line...the picture link i show is exactly what i meant...mathematically calculated
MACD converge and Stochastic converge = vertical line
MACD diverge and stochastic diverge = vertical line
If both against each other than no vertical line required
Try on "Stochastic MACD" as an alternative,if not you found what you saying
Hi thank you for your reply and its almost the way i wanted the vertical line display ....but i wanted the MACD and stochastic itself to show with the standards paramters settings
MACD = 12, 26, 9
Stoch = 5, 3, 3
What i meant exactly based on mathmetical descriptions
When Both MACD + Stochastic then display vertical line ...the picture link i show is exactly what i meant...mathematically calculated
MACD converge and Stochastic converge = vertical line
MACD diverge and stochastic diverge = vertical line
If both against each other than no vertical line required
Please insert the picture correctly! ( ![]() or
or ![]() )
)
What i meant exactly based on mathmetical descriptions
When Both MACD + Stochastic then display vertical line ...the picture link i show is exactly what i meant...mathematically calculated
MACD converge and Stochastic converge = vertical line
MACD diverge and stochastic diverge = vertical line
If both against each other than no vertical line required
Stochastic may have a crossover between the main line and the signal line. MACD may have a crossover between the main line and the signal line.
Do you want to find a bar where both Stochastic and MACD intersect at the same time? But this almost never happens:
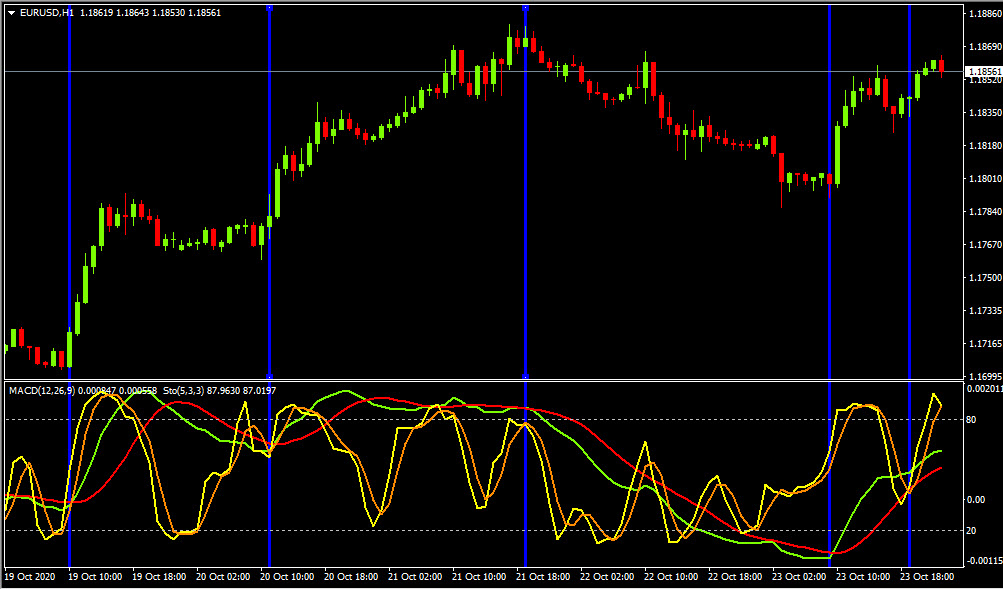
Its difficult to see the display of macd using the histogram...i modified my macd to use line instead of histogram u can see here what i meant in the picture attached
MACD is the Green/Red and the other one is stochastic
Its difficult to see the display of macd using the histogram...i modified my macd to use line instead of histogram u can see here what i meant in the picture attached
MACD is the Green/Red and the other one is stochastic
Why did you bring so many lines into one window? The MACD indicator has only TWO lines: the main one and the signal one. Your drawing contains rubbish and is completely unreadable. Look at my drawing: everything is readable and everything is clear.
I bring them to one window its easier for me to see where the synchronization happen between MACD and Stochastic...The way i present it is much easier although it looks messy and thats why i need the vertical line to represents those points of intersections to clear up my mind besides the vertical line also will display on the chart which point exactly where i should starting to trade..
I bring them to one window its easier for me to see where the synchronization happen between MACD and Stochastic...The way i present it is much easier although it looks messy and thats why i need the vertical line to represents those points of intersections to clear up my mind besides the vertical line also will display on the chart which point exactly where i should starting to trade..
You have placed two DIFFERENT indicators in one window. These indicators have DIFFERENT scales. What you see is optical illusion. Zoom in on the graph and the picture will change dramatically. The fact that you have sketched several indicators in one window - you are deceiving yourself.
- Free trading apps
- Over 8,000 signals for copying
- Economic news for exploring financial markets
You agree to website policy and terms of use
I don't know if this is the correct place to ask...but anyway is there any FREE indicators that draw vertical line when MACD and Stochastic moving in synced. Like example below
If there is none existence how much cost to code this one?