Indicators: Currency Correlation
Forum on trading, automated trading systems and testing trading strategies
Indicators: MFCS Currency Correlation Chart
newdigital, 2013.10.26 09:29
Currency Pairs Correlation in Forex Market: Cross Currency Pairs
As a forex trader, if you check several different currency pairs to find the trade setups, you should be aware of the currency pairs correlation, because of two main reasons:
1- You avoid taking the same position with several correlated currency pairs at the same time and so you do not multiply your risk. Additionally, you avoid taking the positions with the currency pairs that move against each other, at the same time. 2- If you know the currency pairs correlations, it may help you to predict the direction and movement of a currency pair, through the signals that you see on the other correlated currency pairs.
Now I explain how currency pairs correlation helps. Lets start with the 4 major currency pairs: EURUSD ; GBPUSD ; USDJPY and USDCHF.
In both of the first two currency pairs (EURUSD and GBPUSD), USD works as the money. As you know, the first currency in currency pairs is known as the commodity and the second one is the money. So when you buy EURUSD, it means you pay USD to buy Euro. In EURUSD and GBPUSD, the currency that works as the money is the same (USD). The commodity of these pairs are both related to two big European economies. These two currencies are highly connected and related to each other and in 99% of the cases they move on the same direction and form the same buy/sell signals. Just recently, because of the economy crisis, they moved a little differently but their main bias is still the same.
What does it mean? It means if EURUSD shows a buy signal, GBPUSD should also show a buy signal with minor differences in the strength and shape of the signal. If you analyze the market and you come to this conclusion that you should go short with EURUSD and at the same time you decided to go long with GBPUSD, it means something is wrong with your analysis and one of your analysis is wrong. So you should not take any position until you see the same signal in both of these pairs. Of course, when these pairs really show two different direction (which rarely happens), it will be a signal to trade EUR-GBP. I will tell you how.
Accordingly, USD-CHF and USDJPY behave so similar but not as similar as EURUSD and GBPUSD, because in USD-CHF and USDJPY, money is different. Swiss Franc and Japanese Yen have some similarities because both of them belong to oil consumer countries but the volume of industrial trades in Japan, makes JPY different.
Generally, when you analyze the four major currency pairs, if you see buy signals in EURUSD and GBPUSD, you should see sell signals in USDJPY. If you also see a sell signal in USD-CHF, then your analysis is more reliable. Otherwise, you have to revise and redo your analysis.
EURUSD, GBPUSD, AUDUSD, NZDUSD, GBPJPY, EURJPY, AUDJPY and NZDJPY usually have the same direction. Just their movement pattern sometimes becomes more similar to each other and sometimes less.
What do I prefer?
If I find a sell signal with EURUSD and GBPUSD and a buy signal with USDJPY, I prefer to take the short position with one of the EURUSD or GBPUSD because downward movements are usually stronger. I will not take the short position with EURUSD or GBPUSD and the long position with USDJPY at the same time, because if any of these positions goes against me, the other one will do the same. So I don’t double my risk by taking two opposite positions with two currency pairs that move against each other.
How to use the currency pairs correlation to predict the direction of the market?
When I have a signal with a pair, but I need confirmation to take the position, I refer to the correlated currency pairs or cross currency pairs and look for the confirmation. For example I see a MACD Divergence in USDCAD four hours chart but there is no close support breakout in USDCAD four hours or one hour chart. I want to take a short position but I just need a confirmation. If I wait for the confirmation, it can become too late and I may miss the chance. I check a correlated currency pair like USDSGD and if I see a support breakout in it, I take the short position with USDCAD. Now the question is why I don’t take the short position with USDSGD and I use its support breakout to go short with USDCAD? I do it because USDCAD movements are stronger and more profitable. I use USDSGD just as an indicator to trade USCAD.
It happens that you take a position with a currency pair, but it doesn’t work properly and you don’t know if it was a good decision or not. On the other hand, you don’t see any sharp signal on that currency pair to help you decide if you want to keep the position or close it. In such cases, you can check a correlated currency pair and look for a continuation or reversal signal. It helps you to decide about the position you have.
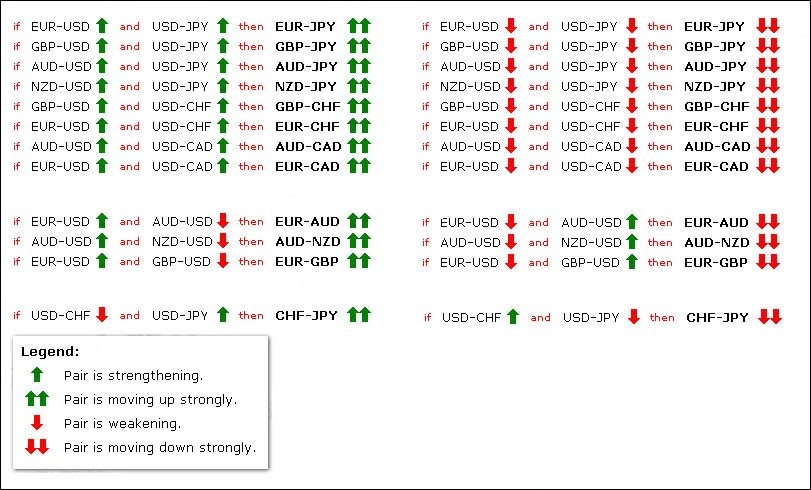
Sometimes, some correlated currency pairs don’t move in the way that they are supposed to move. For example EURUSD and USDJPY go up at the same time, whereas they usually move against each other. It can happen when Euro value goes up and USD value doesn’t have a significant change, but at the same time JPY value goes down, because of some reason. In these cases, you can use the below table to find and trade the currency pair that its movement is intensified by an unusual movement in two other currency pairs. In this example, if EURUSD and USDJPY go up at the same time, EURJPY will go up much stronger (see the below chart).
Or if EURUSD goes up and AUDUSD goes down at the same time, EUR-AUD goes up strongly.
Another important example: If EURUSD goes up and GBPUSD goes down at the same time, EURGBP goes up strongly. Maybe this is the most important case that we can trade based on this rule. It happens many times that EURUSD and GBPUSD move against each other and that is the best time to trade EURGBP. Now you know why EURGBP doesn’t move strongly most of the time. It is because EURUSD and GBPUSD move in the same direction most of the time. For example they go up at the same time and so EURGBP doesn’t show any significant movement because when both of the currencies of a currency pair go up or down at the same time, that currency pair doesn’t show any strong movement and direction (I hope you know why a currency pair goes up or down. It goes up when the first currency value goes up OR the second currency value goes down. For example EURUSD goes up, if Euro value goes up or USD value goes down. If this happens at the same time, then EURUSD goes up much stronger).
The below chart includes almost all of these unusual movements and their results on the third currency pair.
if EURUSD and USDJPY then EURJPY means if EURUSD and USDJPY go up at the same time, then EURJPY goes up much stronger.
Forum on trading, automated trading systems and testing trading strategies
Something Interesting in Financial Video February 2014
newdigital, 2014.02.04 12:10
Currency Correlations, Part IA short video introducing traders to the subject of currency correlations.
Forum on trading, automated trading systems and testing trading strategies
Something Interesting in Financial Video February 2014
newdigital, 2014.02.04 12:14
Currency Correlations, Part II
The second video in a two-part series on currency correlations.
Forum on trading, automated trading systems and testing trading strategies
Indicators: MFCS Currency Correlation Chart
newdigital, 2014.02.04 09:27
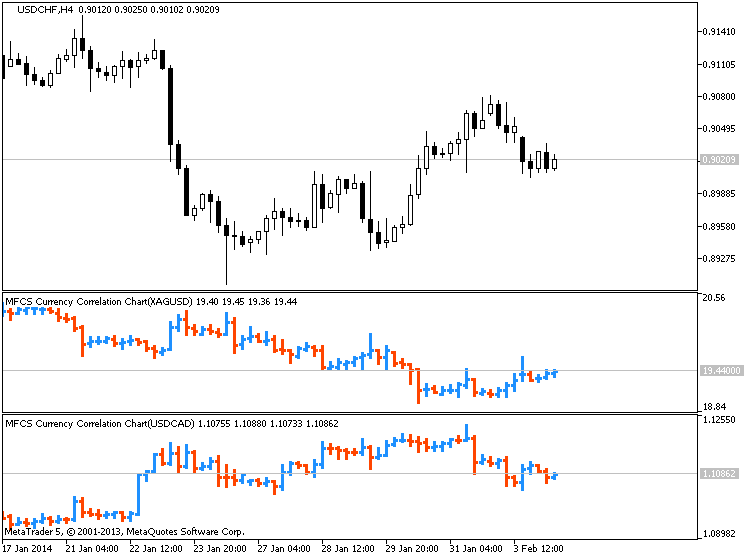
Australian Dollar Strongly Correlated to Gold, Silver, Steel Prices (based on this article)
View forex correlations to the SPDR Gold ETF Trust
(GLD), United States Oil Fund ETF (USO), SPDR Dow Jones Industrial
Average ETF Trust (DIA), UK FTSE 100 Index, and IShares Silver Trust ETF
(SLV) prices: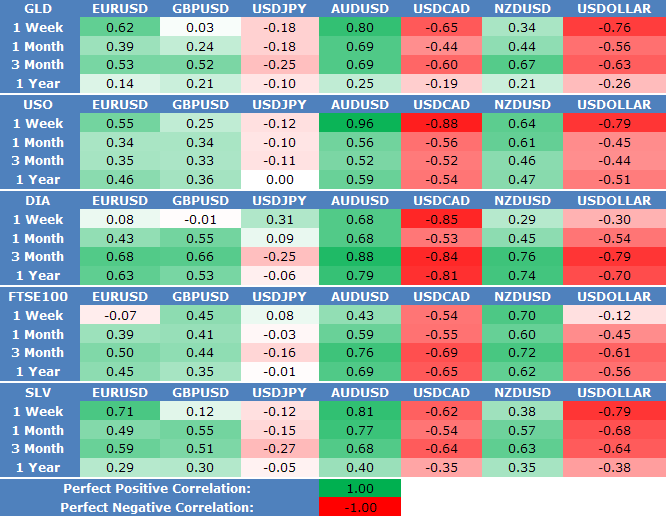
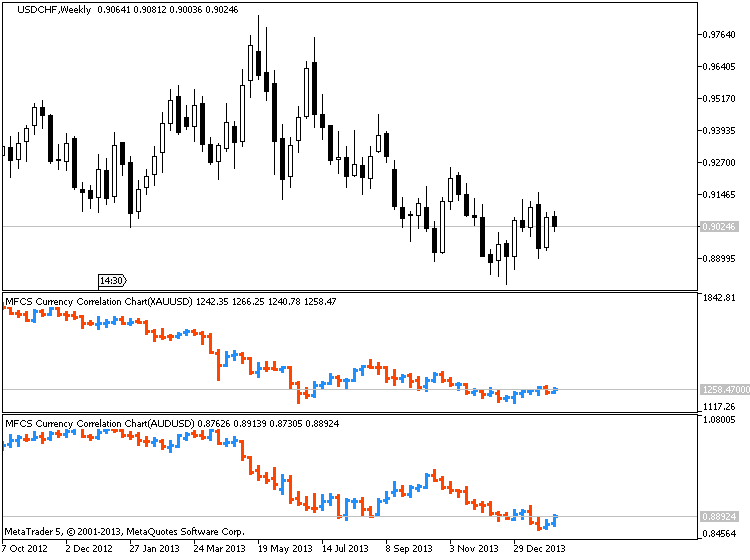
XAUUSD/AUDUSD :
XAGUSD/EURUSD :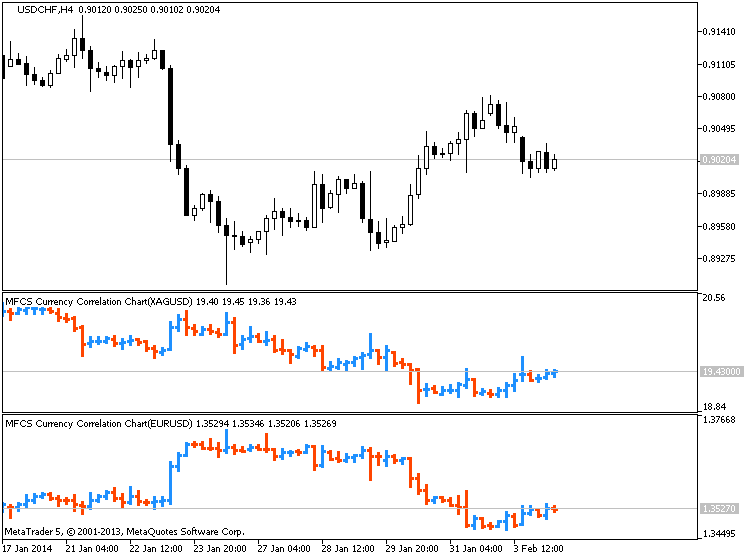
XAGUSD/USDCAD :
Hi,
Sergey,
Good Day !,
I am from India. I am really amazed to see the coding you have done. It has been 8 years, I am trading without co relation and was chasing like a mad dog, analysing why the trade would go wrong, inspite of following the rules of the best system I have got. I was following a very successfull trader named Nathalia, she calls herself as Nasap and she would trade with 100% result.
After I have used your code, I am able to see how important co relation is.
My humble request to you, could you please code the same for our Indian Index? like Nifty, CNXIT and other index's as well.
Please write back to me on tvravikiran@yahoo.co.in or my skype id is venusenterprises
Regards,
Ravi
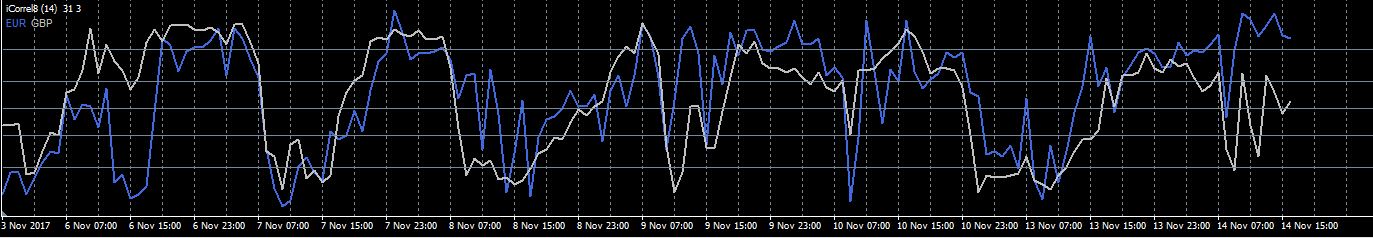
Hi Sergey,
Thanks for the post. I'm trying to understand the iCorrel8 indi a little better. I chose "EUR and GBP" in the settings. The tracings seem to "correlate" nicely. So does this mean that "EURUSD AND THE GBPUSD" are highly correlated and that price movement for both these pairs is expected to move in the same direction? See attached.
Also, when setting is set to AUTO; what does this graph indicate? What is the range of correlation +/-? Is it +1.0 to -1.0, +.8 to -.8, or +.3 to -.3.
Thanks Sergey. @Sergey Golubev @Sergey Golubev
Dear Coder,
Thank you very much for the correl8 MT4 indicator.
Im using it in my trading to get an objective and accurate view on trends in the currency markets.
Would it be possible to also code this indicator in mq5 to work on the MT5 platform?
It would be really great.
Kind regards.
Refer to Correl8b indicator on this page.
First of hats off to the contributor who made an excellent currency strength indicator which does the job.
Really well done. Thank you.
The word correlation is misleading in the sense that this indicator is not the Spearman's Rank Coefficient of Correlation between two currencies or two commodities.
What this indicator is is an equally-weighted currency strength indicator. Here is the code that defines each index:
USD=-(EUR+GBP+AUD+NZD+CHF+CAD+JPY+XAU)/(indicator_buffers-1); //USD relative to other
EUR += -(GBP + AUD + NZD + CHF + CAD + JPY + XAU)/(indicator_buffers-2); //Currency relative to USD
GBP += -(EUR + AUD + NZD + CHF + CAD + JPY + XAU)/(indicator_buffers-2);
AUD += -(EUR + GBP + NZD + CHF + CAD + JPY + XAU)/(indicator_buffers-2);
NZD += -(EUR + GBP + AUD + CHF + CAD + JPY + XAU)/(indicator_buffers-2);
CHF += -(EUR + GBP + AUD + NZD + CAD + JPY + XAU)/(indicator_buffers-2);
CAD += -(EUR + GBP + AUD + NZD + CHF + JPY + XAU)/(indicator_buffers-2);
JPY += -(EUR + GBP + AUD + NZD + CHF + CAD + XAU)/(indicator_buffers-2);
This code tells me that it is an currency strength index where all the other currencies, including gold, used in the calculation have an equal weight.
The source code given does not calculate the currency strength index to all the other currencies (EUR, GBP, AUD, NZD, CHF, CAD, JPY).
The source code given also does not calculate index values too far back into the history
I modified the source code to give the other index values and provide historical index values.
Yes we can use this method to determine the correlation between two commodities.
A future variation of this indicator could be the weighted-index (giving some currencies more weight than other currencies).
- Free trading apps
- Over 8,000 signals for copying
- Economic news for exploring financial markets
You agree to website policy and terms of use
Currency Correlation:
Correlation between 8 currencies.
Author: pipPod