ChartXYToTimePrice
Of course, they do, top of the window is Y=0. Subtract from window height.
Well, subtracting from window height is not an optimal option, takes extra time and is prone to miscalculation down the road.
Isn't it a better way, a code solution to make the Y scale starting from 0 same as X scale do ?
Your support is greatly appreciated !
luc
Well, subtracting from window height is not an optimal option, takes extra time and is prone to miscalculation down the road.
Isn't it a better way, a code solution to make the Y scale starting from 0 same as X scale do ?
Your support is greatly appreciated !
luc
Y does start from 0
...starts from 0 but from the screen upper left corner ?
Do you find it normal that Y scale point to its 0 (instead of infinite) as moves upwards and X scale point to its infinite (rightly so) as it moves to the right ?
I didn't see such a weird chart model like this.
Indeed it prints some XY values of its own but I can't import them into a normal XY chart like desmos chart... Y scales point differently so obviously the result is different.
All is needed is that MT4 and desmos XY scales are a match in heaven ...common sense right ?
I hope that the issue is clear now.
Once again your help is highly appreciated !
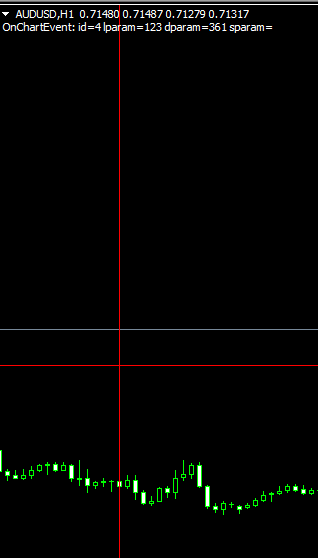
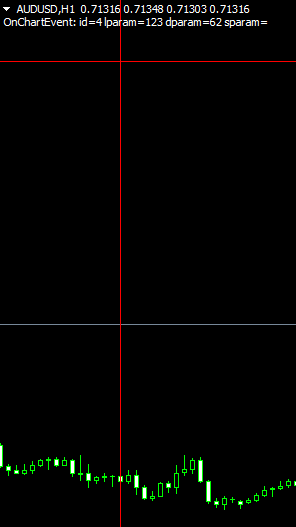
lparam=x
dparam=y
- Free trading apps
- Over 8,000 signals for copying
- Economic news for exploring financial markets
You agree to website policy and terms of use
Hello,
Bellow is the Sample EA code found on https://docs.mql4.com/chart_operations/chartxytotimeprice.
Currently, Y axis numbers are descending as they follow the arrow upwards
Can you please amend the code so that Y axis numbers are ascending as they follow the arrow...upwards.
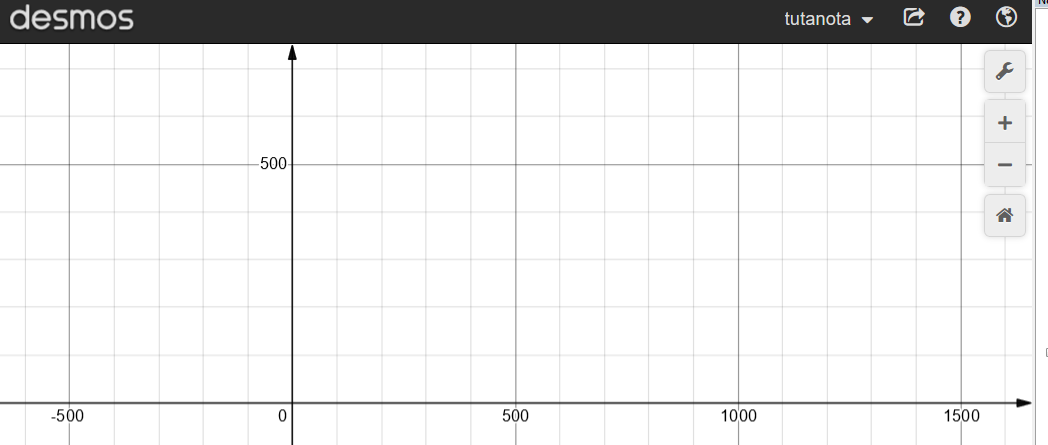
X axis is OK , Why? I'm importing XY values into www.desmos.com/calculator and their XY axes are counting from 0 upwards following the arrows.
Thank you very much !
luc