Hello!
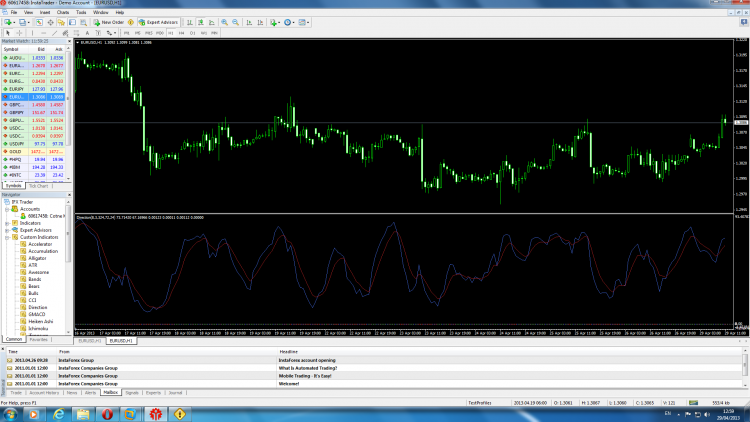
I have constructed an indicator drawing 2 lines. The problem is that, one of them obtains its values from the range [95,100] and another somewhere between [-0.05,0.05]. Im not concerned with the values of the first (big) one. Im only observing its increasing-decreasing regions. So my question is:how to scale down a big indicator in order to manage to fit them both into a single window? Should I simply subtract a fixed amount? When I do this (i donno why but...) its shape is changed.
Thanks
Simply subtracting a number from it is not scaling it but it is offsetting it, if you want to scale it down you need to multiply the values by a number between 0 and 1, so for a 50% scaling multiply by 0.5
Thank you.
I did it but it changes the shape. There are 2 lines (Stoch and singnal) in the indicator I want to scale down. When I divide the values by 1000 for example, their intersection regions are mixed I donno why.
Thank you.
I did it but it changes the shape. There are 2 lines (Stoch and singnal) in the indicator I want to scale down. When I divide the values by 1000 for example, their intersection regions are mixed I donno why.


The lines are not intersecting as they have different ranges of values . . . perhaps you should show some before and after pictures.
I tried to simplify the problem, that's why I wrote 2 lines. Actually there are 2 lines above (big, which I want to scale down) and histogram below.
Here are the pictures uploaded.
Before and after this:
StoBuffer[i] /= 1000;
SigBuffer[i] /= 1000;
Perhaps you would be better having these 2 Indicators displaying in 2 separate sub windows ?
I had them in 2 separate windows but my goal is to unite them into one. Could you possibly give me a link explaining how to create sub-windows? Ill try that approach.
Thank you very much for help friend.
I had them in 2 separate windows but my goal is to unite them into one. Could you possibly give me a link explaining how to create sub-windows? Ill try that approach.
Thank you very much for help friend.
By sub windows I meant separate windows below the main window, if that is where you started from you probably don't want to go back there.
If you simply want to avoid the lines crossing the histogram you should add an offset, perhaps 0.07 after you have scaled the values.
By sub windows I meant separate windows below the main window, if that is where you started from you probably don't want to go back there.
If you simply want to avoid the lines crossing the histogram you should add an offset, perhaps 0.07 after you have scaled the values.
Yeah I dont want to be back there.
No crossing the histogram is not a problem, the problem is that the lines above in range [95-100] were correct and once I multiply it by 0.001 Stoch becomes greater than Signal for every bar which is very confusing, I dont understand the reason.
Abyway, Ill try something. Thanks a lot for great help.
- Free trading apps
- Over 8,000 signals for copying
- Economic news for exploring financial markets
You agree to website policy and terms of use
I have constructed an indicator drawing 2 lines. The problem is that, one of them obtains its values from the range [95,100] and another somewhere between [-0.05,0.05]. Im not concerned with the values of the first (big) one. Im only observing its increasing-decreasing regions. So my question is:how to scale down a big indicator in order to manage to fit them both into a single window? Should I simply subtract a fixed amount? When I do this (i donno why but...) its shape is changed.
Thanks