Forum on trading, automated trading systems and testing trading strategies
newdigital, 2014.06.05 09:41
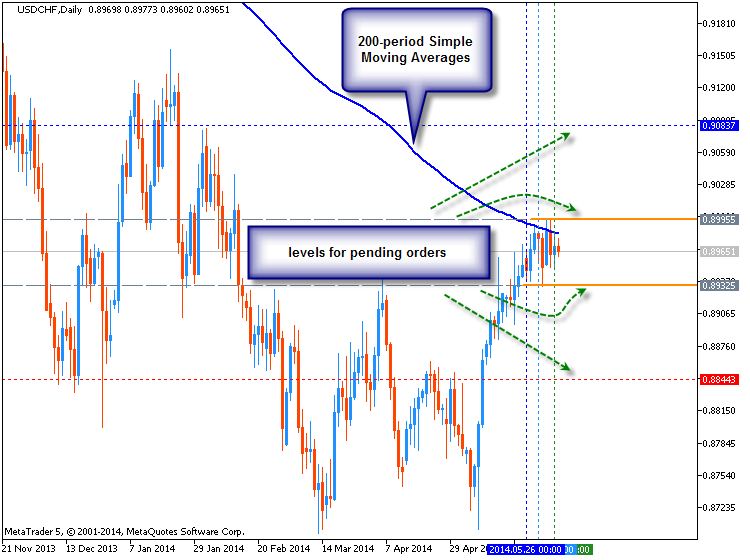
USDCHF Breakout Hindered by 200-Day Moving Average (adapted from dailyfx article)
- The USDCHF break has run into the 200 Day Moving Average.
- Potential buyers could enter upon a confirmed break above the 200 Day MA.
The 200-Day Simple Moving Average
The 200-Day Simple Moving Average is one of the most popular indicators
in the world. When price breaks through a 200 MA on a daily chart, it
can often be seen as a topic of conversation on financial news stations,
websites and newspapers.
It is primarily used to give traders and investors an overall sense of how strong or weak a currency pair is.
Typically, when a currency pair’s price falls below the 200 Day MA, it
is a sign of weakness with a potential for further price decline. And
when a currency pair’s price breaks above the 200 Day MA, it is a sign
of strength with a potential for further price increases.
The chart above shows the recent price action surrounding the 200 Day
MA. We see a large run up in price breaking through multiple resistance
levels until it met this powerful MA line. We have had 6 consecutive
days where price has temporarily broke through the 200 Day MA or price
has come within 10 pips of the line before retreating lower. So this
level is acting as strong resistance.
If price were to remain below the MA, it could propel it lower back into
the pair’s price channel. However, a breakout to the upside could add
yet another reason to buy the USDCHF. Until we witness a larger price
move, we are in a state of limbo.
- Free trading apps
- Over 8,000 signals for copying
- Economic news for exploring financial markets
You agree to website policy and terms of use
3 EMA Crossover:
Author: Simphiwe Ncube